%20(1)-Jan-02-2024-09-05-00-8712-PM.jpg?width=300&height=175&name=Untitled%20design%20(2)%20(1)-Jan-02-2024-09-05-00-8712-PM.jpg)
%20(1)-Mar-08-2024-09-22-41-1011-PM.jpg?width=300&height=175&name=Untitled%20design%20(5)%20(1)-Mar-08-2024-09-22-41-1011-PM.jpg)
%20(1)-Mar-08-2024-09-27-14-7268-PM.jpg?width=300&height=175&name=Untitled%20design%20(6)%20(1)-Mar-08-2024-09-27-14-7268-PM.jpg)

%20(1)-Mar-08-2024-09-11-30-0067-PM.jpg?width=300&height=175&name=Untitled%20design%20(3)%20(1)-Mar-08-2024-09-11-30-0067-PM.jpg)
%20(1)-Mar-08-2024-09-18-53-4361-PM.jpg?width=300&height=175&name=Untitled%20design%20(4)%20(1)-Mar-08-2024-09-18-53-4361-PM.jpg)
-Mar-08-2024-09-03-21-1119-PM.jpg?width=300&height=175&name=Untitled%20design%20(1)-Mar-08-2024-09-03-21-1119-PM.jpg)
-2.png?width=264&height=160&name=Website%20Featured%20Content%20Images%20(1)-2.png)
-Mar-08-2024-08-50-35-9527-PM.png?width=300&height=175&name=Untitled%20design%20(1)-Mar-08-2024-08-50-35-9527-PM.png)


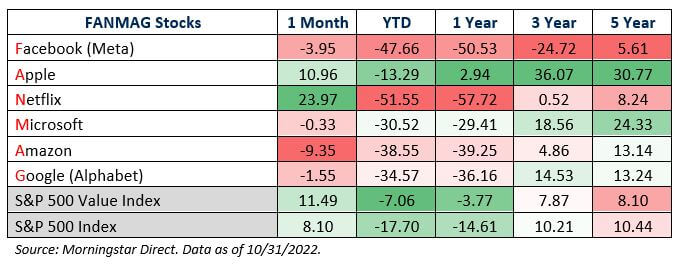
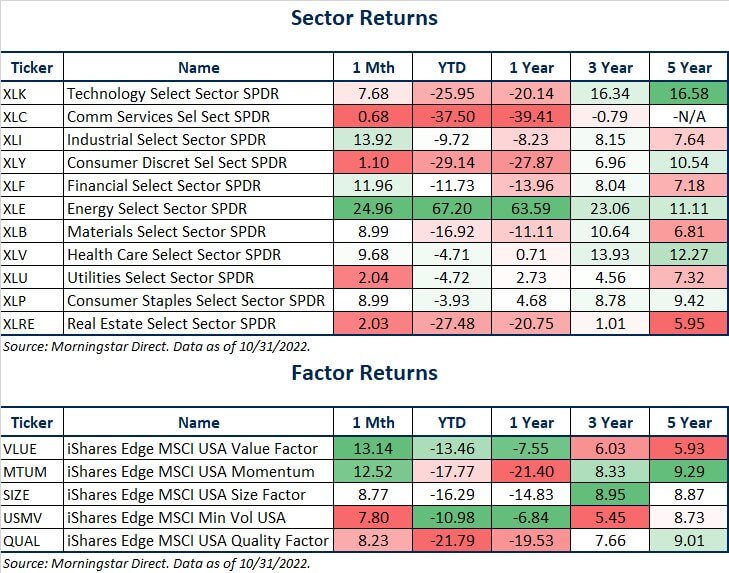
It has been a very tough start to the year for a handful of extremely popular large-growth companies. Collectively known by the acronym ‘FANMAG,’ the group includes Facebook (Meta), Apple, Netflix, Microsoft, Amazon, and Google (Alphabet). They have posted some eye-popping returns in recent years but have largely struggled as of late.
As the table below illustrates, the five-year returns generated by these businesses have generally exceeded the market, represented by the S&P 500. Netflix and Facebook are notable exceptions due to large year-to-date losses. So far, in 2022, Facebook has shed 47.7% of its value, while Netflix is down 51.6%. With the exception of Apple, the other FANMAG companies are dramatically underperforming the market year-to-date as well.
The chart below illustrates the reversal of fortune for the FANMAGs in another way. The line represents the cumulative outperformance of the FANMAGs relative to the Russell 3000 over the last five years. Looking at this chart, it’s not hard to see why they garnered their own acronym. From November of 2017 through December of last year, the FANMAGs outperformed the Russell 3000 by nearly 150%, which was up nearly 100% itself at one point during the period! Since the peak last year, the decline has been swift. By the end of October, the FANMAGs have given back a substantial portion of their outperformance.
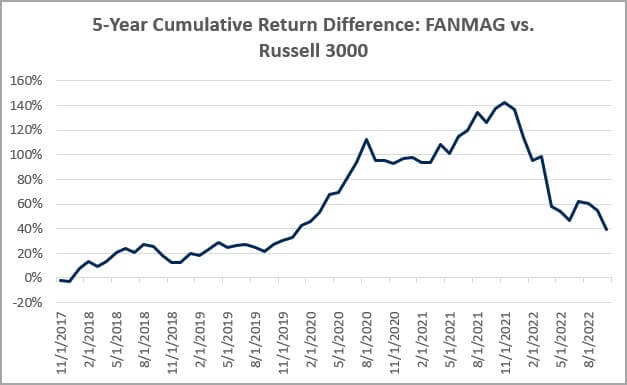
Source: Morningstar Direct as of 10/31/2022. Returns are cumulative & calculated monthly. The FANMAG return is based on an equally weighted portfolio of the six component companies.
There are a variety of reasons these companies have been under substantial pressure. The Federal Reserve’s policy shift aimed at combating inflation has arguably been the most prominent cause, as rising rates have hit high-growth companies hardest. It’s probably not a coincidence that the peak in FANMAG outperformance roughly coincided with Chairman Jerome Powell’s statement before Congress in November that ‘transitory’ was no longer the most accurate term for describing the current bout of high inflation.
When investors purchase a growth stock, they are usually doing so on the basis of a large potential payoff far in the future rather than substantial earnings and shareholder distributions today. Consequently, growth stocks have a higher duration (more interest rate sensitivity) than value stocks in a similar way that long-term bonds are higher duration than short-term bonds.
Another reason for the struggling performance relates to poor earnings reports and forward guidance. Last week, several of these companies released their third-quarter results, only to be hammered after missing estimates and providing a weak outlook. Facebook (Meta) fell 25% in a single day, Google (Alphabet) fell 10%, Microsoft fell 8%, and Amazon is down 16% since publishing. Netflix was able to surprise to the upside this quarter but fell 35% in a day in April after reporting its first quarterly loss of subscribers in over ten years. Apple is the lone FANMAG company that has outperformed the broad market this year, though it still trailed value stocks.
The chart below provides some insight into why the FANMAG stocks have been punished so brutally following earnings reports. It illustrates the valuation of the top 10 stocks of the S&P 500 vs. the remaining companies and the Index as a whole. While the top 10 stocks don’t perfectly align with the FANMAGs, there has been substantial overlap over time, making it a reasonable comparison. As you can see from the chart, there have been two periods in recent decades where the valuation of the ten largest stocks has become significantly dislocated from the rest of the market. The first period was during the technology bubble of the late 1990s. We still find ourselves within the second period, despite the rapid correction we have been experiencing.
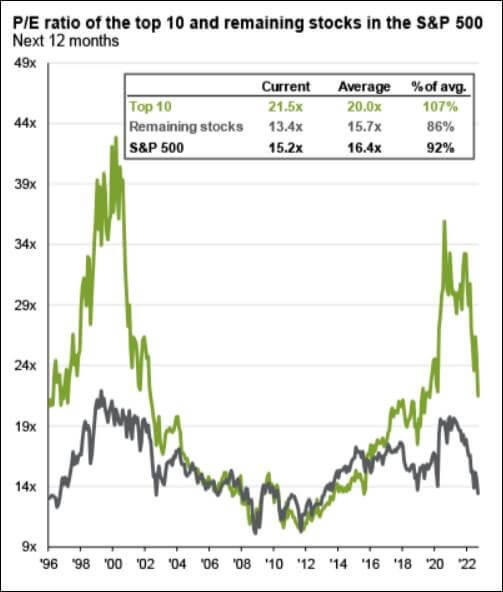
Source: JP Morgan Asset Management. Data as of 9/30/2022.
It requires extreme optimism from investors to stretch the valuation as dramatically as the ‘Top 10’ had been in the above chart. When a stock fails to deliver on these ever-rising expectations, the snapback can make for a rude awakening. While valuations did not quite reach the same extreme we saw during the tech bubble this time around, they seem to be deflating at a similar speed. Note that this chart is only through 9/30/2022, and the green line likely moved substantially lower during October.
Investors may be tempted to purchase some of these companies following their steep declines over the last few months. While it’s certainly possible, they will regain their operational footing and recapture investor imaginations, a major challenge they face is that they increasingly compete with each other. For example, two or more of these stocks compete in each of the following markets: streaming services, cloud computing, advertising, and search. These companies sported sky-high valuations because their growth had been so strong for so long. Now growth seems harder to come by, despite valuations that are still stretched. That is not a recipe for strong returns moving forward.
WEEK IN REVIEW
- Last week was a big one for earnings announcements, with a few of the large tech giants undershooting forecasts. According to FactSet, 52% of the S&P 500 has reported Q3 results as of last Friday’s close. The earnings growth rate, blended between companies that have already reported with the estimates for those that have yet to report, is at 2.2% year-over-year. This is slightly below FactSet’s forecast of 2.8% at the start of earnings season, and would mark the slowest earnings growth since the third quarter of 2020. If it wasn’t for the energy sector, earnings would actually be negative for Q3.
- It’s a big week for economic data reports. On Tuesday, we will get an update on manufacturing activity, job openings and quits. Thursday will have jobless claims (a proxy for layoffs) and an update on the services sector. The week of economic data will be headlined by the Non-Farm Payrolls report due on Friday.
- In addition to the big week for economic data, the Federal Reserve will conclude its two-day monetary policy meeting on Wednesday. The market is currently pricing in a 0.75% hike, which would bring the benchmark federal funds rate to a range between 3.75% to 4.00%. The market will watch the post-meeting press conference with Fed Chairmen Jerome Powell (Wednesday at 1:30 CT) for clues as to when and how the Fed might begin to slow the pace of rate increases.
HOT READS
Markets
- U.S. GDP Accelerated at 2.6% Pace in Q3, Better Than Expected as Growth Turns Positive (CNBC)
- Key Inflation Gauge For The Fed Rose 0.5% In September, In Line With Expectations (CNBC)
- Animation: The Largest Public Companies by Market Cap: 2000-2022 (Visual Capitalist)
Investing
- What to Do When You Know What Stocks Will Do Next (Jason Zweig)
- Cumulative vs Cyclical Knowledge (Morgan Housel)
- IN the Markets Nothing is As Dependable as Cycles (Ben Carlson)
Other
- How To Watch Football Like an Expert from the Comfort of Your Own Couch (The Athletic)
- Win or Lose, Mickey Joseph Believes His Time is Now at Nebraska (Sports Illustrated)
- The Hunt for the Dark Web’s Biggest Kingpin, Part 1: The Shadow (Wired)
MARKETS AT A GLANCE
Source: Morningstar Direct.
Source: Morningstar Direct.
Source: Treasury.gov
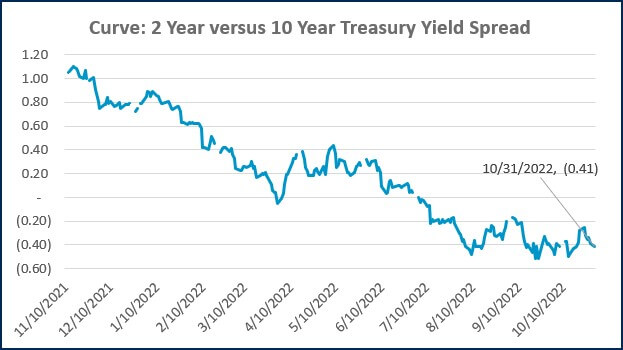
Source: Treasury.gov
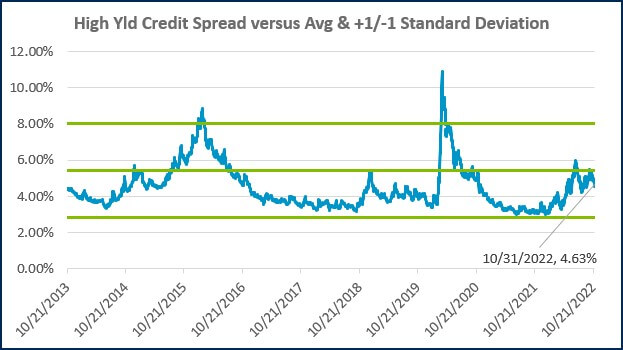
Source: FRED Database & ICE Benchmark Administration Limited (IBA)
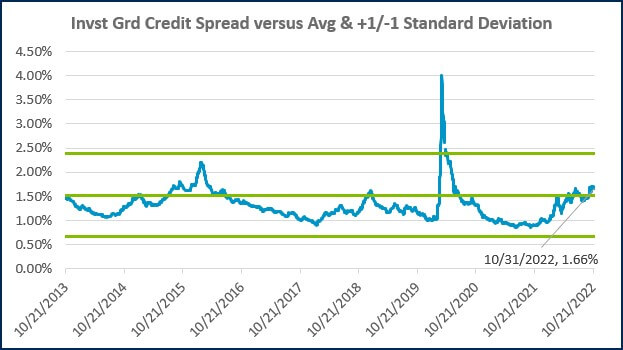
Source: FRED Database & ICE Benchmark Administration Limited (IBA)
ECONOMIC CALENDAR
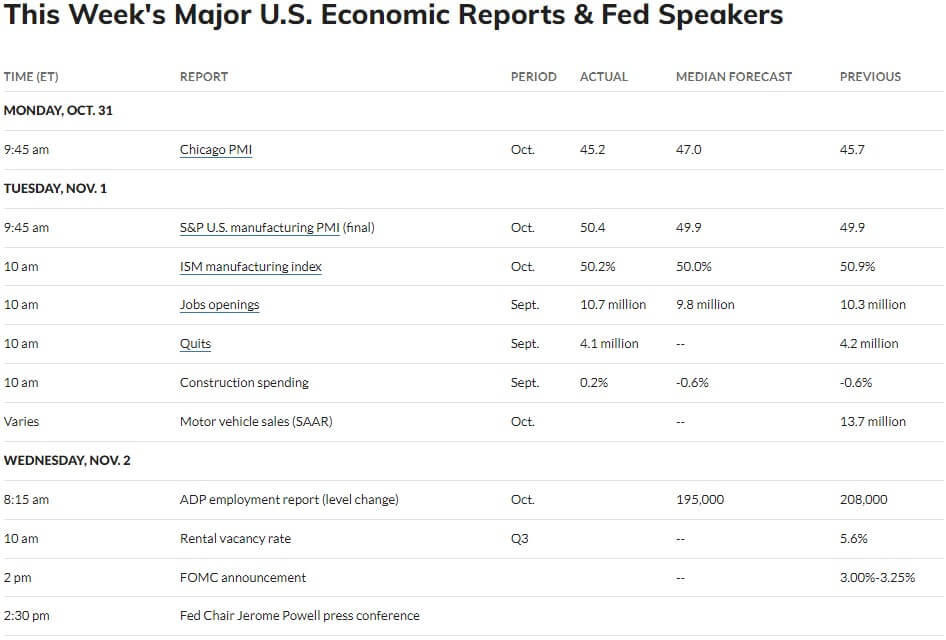
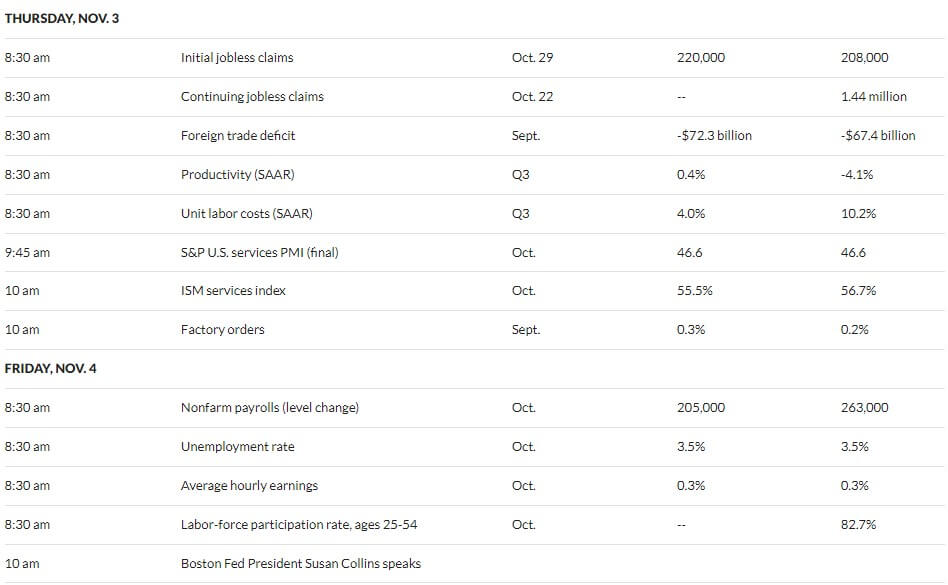
Source: MarketWatch

- Achiever, Competition, Ideation, Significance, Command
Josh Jenkins, CFA
Recent News & Insights

How Often Does Large-Growth Outperform? + 4.16.24

W-4 Exemption for Taxpayer's Dependents

Tax-Free Roth Strategies: Backdoor Roth IRA & Mega Backdoor Roth
What does the election mean for your investments? + 4.02.24

