














Joe Donovan and Steve Nebbia

Your business can grow every year, yet you may still struggle to answer a simple question: Are we making progress toward our long-term financial goals? Add a second entity, a rental property, and another investment account, and the financial picture that used to fit on one page starts living in five different places.
That is the wealth paradox: more assets often mean less clarity, not more. Each addition makes sense on its own. Together, they create more questions than answers because the information exists somewhere, but it lives in too many places for anyone to see it all at once. We’ll walk through why that happens, the three financial reports that answer your biggest questions, and the five numbers worth tracking over time.
Common Challenges of Growing Wealth
Complexity tends to create three related problems that build on each other.
1. Data Silos
Personal and business finances begin to blur together. Personal expenses run through the business, making it hard to tell what belongs where. Meanwhile, your bank, brokerage, and accounting systems don't communicate, making it nearly impossible to create a complete financial picture.
2. Unreliable Reporting
When definitions and categories don't match across entities and systems, confidence in the numbers starts to erode. Reports on the same topic can produce different answers, making it hard to compare performance and spot trends over time.
3. Decisions with Hidden Risk
Reports are often built from partial data gathered at different points in time. As a result, critical blind spots emerge. You may not know how much liquidity is available across all accounts, what your true debt exposure looks like, where cash is actually going, or how everything connects.
Meet David & Emily
David and Emily are in their late forties and own a successful manufacturing company. By most measures, they're doing well, but their growing financial complexity makes it hard to answer key planning questions.
Their financial picture includes:
- Manufacturing company with $4.2 million in business assets and $1.1 million in related debt, representing $3.1 million in net business equity
- Annual household income of $620,000
- Primary residence plus two rental properties with a combined value of $1.8 million, subject to $900,000 in mortgages
- $1.3 million in investment accounts
- $1.1 million in retirement savings
- $2.0 million in mortgage and business debt
Like many business owners, they aren't asking whether they're successful. They're asking whether they're making the right financial decisions as their wealth grows and becomes more complex.
Their challenge is not making money. It is answering questions like:
- Are we actually getting wealthier?
- Can we afford another investment property?
- How much cash should we keep available?
- Are we taking on too much debt?
- What happens if the business slows down?
A bank balance answers only how much cash is available today, while a tax return primarily reports information for tax compliance. To evaluate the questions above, David and Emily need a balance sheet, a profit and loss statement, and a personal budget and cash flow view. Each report answers a different part of the decision.
Balance Sheet: Where are we today?
A balance sheet provides a snapshot of your financial position at a specific point in time. It shows what you own, what you owe, and the net worth you've built across your business and personal finances.
|
ASSETS
|
|
|
Cash
|
$240,000
|
|
Investments
|
$1,300,000
|
|
Retirement
|
$1,100,000
|
|
Business Assets
|
$4,200,000
|
|
Real Estate
|
$1,800,000
|
|
TOTAL ASSETS
|
$8,640,000
|
|
LIABILITIES
|
|
|
Mortgages
|
$900,000
|
|
Business Loans
|
$850,000
|
|
Business Line of Credit
|
$250,000
|
|
TOTAL DEBT
|
$2,000,000
|
|
NET WORTH
|
$6,640,000
|
The headline is a strong net worth of $6.64 million. The detail underneath is more interesting. Nearly half of their assets are tied to the business, while cash represents only a small portion of their overall wealth. On paper, they're wealthy. In practice, they may have less flexibility than they realize.
Profit & Loss: What is happening to my money?
A profit and loss statement shows business revenue and expenses over a period of time. It helps owners evaluate profitability, operating performance, and whether results are sustainable.

The $8.5 million in revenue less $8.2 million in expenses produces $300,000 in accounting profit, but a profit and loss statement does not show the timing of cash receipts and payments or how much liquidity the owners have available for a major purchase. Profitability is important, but it is only one part of financial flexibility.
Personal Budget & Cash Flow: Do we have enough cash when we need it?
A personal budget and cash flow view shows how money moves through the household. It helps business owners understand spending, savings capacity, and the cash available for opportunities or unexpected expenses.

To connect business profit to household cash in this example, assume the owners receive the full $300,000 profit as cash distributions, the $250,000 salaries are already deducted in business expenses, and the $70,000 of rental and investment income is cash after related costs. Also assume living expenses include current personal debt service and all $240,000 of cash is available to the household; business working capital is not an additional personal reserve.
This household view shows $620,000 in annual cash inflows against $300,000 in living expenses and $200,000 in taxes, leaving $120,000 before planned savings. After setting aside $100,000, the couple has $20,000 in discretionary surplus. Savings transfers are an allocation of cash, not an expense. What it does not do is answer one of David and Emily's biggest questions: can they afford to purchase another rental property? A $20,000 annual surplus on $620,000 of income is a thin margin, and no income statement will tell you what happens to it under stress.
Five Financial Metrics Every Business Owner Should Track
The three reports provide the financial foundation. The five metrics below help owners summarize the most decision-relevant information and monitor whether the overall picture is improving, weakening, or staying flat over time.

For David and Emily, the current snapshot includes $6.64 million of net worth, $2.0 million of debt, and about five months of personal expenses in cash reserves. The value is not in reading those numbers once. It is in comparing them consistently and understanding whether the trend supports their goals.
Red Flags in Your Financial Statements
Financial problems rarely begin with a crisis. They often appear first as a combination of smaller signals. Reviewing those patterns helps owners decide when closer analysis or a change in course is needed.
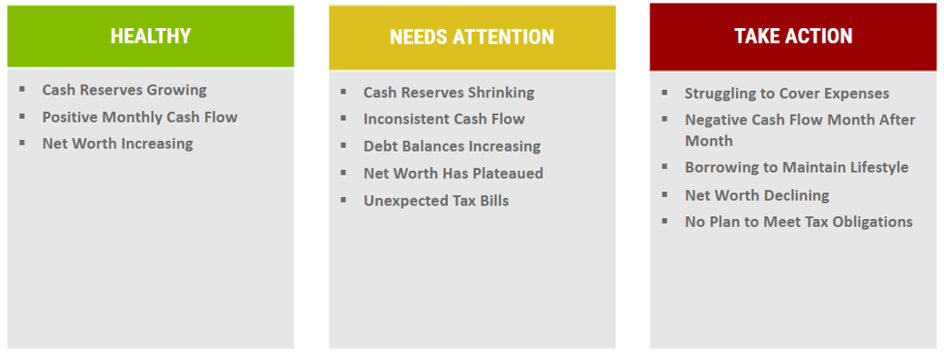
The middle column is easy to overlook because no single item necessarily signals a crisis. However, shrinking reserves, rising debt, and a flat net worth appearing together deserve attention, especially during a profitable year.
The $850,000 Question
David and Emily are considering another rental property with an $850,000 purchase price and a $170,000 down payment. The first question is often whether rental income, after operating costs and vacancy allowances, can support the new debt payments. A stronger analysis also considers how the purchase affects liquidity, debt, resilience, and progress toward long-term goals.
|
MEASURE
|
BEFORE PURCHASE
|
AFTER PURCHASE
|
IMPACT
|
|
Net worth
|
$6.64 million
|
$6.64 million
|
No Change at closing
|
|
Liquidity
|
$240,000
|
$70,000
|
↓ $170k
|
|
Total debt
|
$2.0 million
|
$2.68 million
|
↑ $680k
|
|
Cash Reserve
|
About 5 months
|
About six weeks
|
Materially Reduced
|
Net worth doesn't move at closing because buying an asset essentially trades cash for equity rather than creating wealth. What changes is resilience. Liquidity falls from $240,000 to $70,000 and total debt rises from $2.0 million to $2.68 million. A five-month cash reserve becomes closer to six weeks for a household with an annual surplus of $20,000. That doesn't make the property a bad investment. It means the timing may introduce more risk than David and Emily are prepared to carry. The reports work together to make that tradeoff visible.
That doesn't make the property a bad investment. It means the timing may introduce more risk than David and Emily are prepared to carry. The reports work together to make that tradeoff visible.
Before any significant decision, ask these questions:
- What happens to cash flow?
- What happens to net worth?
- What's the downside if things go wrong?
- Where does this put you in five years?
How Lutz Can Help
As your business and personal finances become more complex, having accurate reporting and a clear view of how the pieces connect becomes increasingly important. Lutz's accounting and advisory professionals work with business owners to bring greater clarity to financial reporting. Whether you need outsourced accounting support, better financial visibility, cash flow analysis, forecasting, or tax planning, our team can help you understand what your numbers are telling you and use that information to make more informed decisions. Contact us to start the conversation.
To hear Lutz experts discuss this topic further, you can view our webinar.

- Achiever, Individualization, Strategic, Focus, Learner
Joe Donovan
Tax Shareholder
Joe Donovan, Tax Shareholder, began his career in 2012. Over the past decade, he has built comprehensive expertise in taxation while taking on significant leadership roles. Joe serves on both the board of directors and the Lutz Financial board and contributes to the firm's strategic direction through the tax policy committee.
Leveraging his knowledge in business and income tax planning, Joe focuses on serving clients in the private equity, construction, real estate, and family office sectors. As a Chartered Advisor in Philanthropy, he provides comprehensive tax and estate planning solutions that align with clients' broader financial goals. Joe thrives on partnering with his clients to boost their business profitability, aiming to be their most trusted advisor not just for tax planning but for general business decisions as well.
At Lutz, Joe exemplifies the firm's commitment to being an expert through his strategic approach to complex tax matters. His dedication to continuous learning and ability to understand each client's unique situation enables him to develop tailored solutions that drive success. As a leader in the firm, he actively contributes to fostering growth and developing the next generation of tax professionals.
Joe lives in Omaha, NE, with his wife Franci and their children Jack, Katie, and Danny. Outside the office, he can be found spending time with family, traveling, and reading.

- Communication, Achiever, Competition, Activator, Maximizer
Steve Nebbia
Consulting Shareholder
Steve Nebbia, Consulting Shareholder, began his career in 2012. He has developed comprehensive expertise in business consulting while serving on the Client Advisory Services policy committee and contributing to the service line’s growth.
Specializing in outsourced accounting and advisory services, Steve focuses on helping businesses and nonprofits strengthen their financial operations. He provides business coaching and planning, real-time reporting, tax compliance, and projections to help clients navigate complex challenges. Steve values delivering actionable insights through data-driven analysis.
At Lutz, Steve’s ability to embrace change has been instrumental in shaping the firm’s outsourced accounting service line. He played a key role in building the offering from the ground up, championing the adoption of new technologies, scalable processes, and strategic enhancements. By combining clear communication with a forward-thinking approach, Steve consistently transforms data into impactful solutions that drive results for both clients and the firm.
Steve lives in Omaha, NE, with his wife Morgan and their children Joe, Maddie, and Jacob. Outside the office, he can be found cheering on the Huskers and spending time with family and friends.
Recent News & Insights

Accounting
Know Your Numbers: The Financial Reports Every Business Owner Should Understand
Your business can grow every year, yet you may still struggle to answer a simple question: Are ...

Recent News
Lutz adds Kemp & Tichota as Senior Accountants
Lutz, a Nebraska-based business solutions firm, recently added Ben Kemp and Colby Tichota to ...

Recent News
Lutz adds Jon Fagan as Chief Information Officer
Lutz, a Nebraska-based business solutions firm, recently added Jon Fagan as Chief Information ...

Ag
Nebraska Tax Incentives for Ag Businesses
Nebraska offers tax incentives to various business types, including ag companies. This guide ...


Let’s get you where you want to go.
We work to simplify complexities, help make critical business decisions, and confidently focus on the things that are truly important to you. We embrace your business as our own to spark the right solutions and help you thrive.