%20(1).jpg?width=264&height=160&name=Website%20Featured%20Content%20Images%20(2)%20(1).jpg)
%20(1).jpg?width=300&height=175&name=Mega%20Menu%20Image%20(2)%20(1).jpg)
%20(1)-Mar-08-2024-09-27-14-7268-PM.jpg?width=300&height=175&name=Untitled%20design%20(6)%20(1)-Mar-08-2024-09-27-14-7268-PM.jpg)

%20(1)-1.jpg?width=264&height=160&name=Website%20Featured%20Content%20Images%20(2)%20(1)-1.jpg)
-1.jpg?width=264&height=160&name=Website%20Featured%20Content%20Images%20(1)-1.jpg)
%20(1).jpg?width=264&height=160&name=Website%20Featured%20Content%20Images%20(3)%20(1).jpg)
%20(1).jpg?width=264&height=160&name=Website%20Featured%20Content%20Images%20(4)%20(1).jpg)
-Mar-08-2024-08-50-35-9527-PM.png?width=300&height=175&name=Untitled%20design%20(1)-Mar-08-2024-08-50-35-9527-PM.png)


.jpg)


Psychologists say that investors feel the pain of portfolio declines twice as intensely as they do the joy associated with gains(1). Consequently, it’s not hard to see why it’s so common for investors to throw in the towel when the markets are choppy. Dealing with the anguish produced by volatility is one of the most challenging aspects of investing. The mere fact that it is hard, however, is a major reason it can be so rewarding.
All investments carry some sort of risk, and a relatively safe asset class like cash (or cash equivalent) is no different. While investors generally don’t have to worry about the value of their savings accounts, CDs, money market funds, or Treasury bills declining, there are a few things they do need to be concerned about. The purchasing power of their cash could decline over time (inflation risk), and the interest being generated could also fall (reinvestment risk).
Inflation and reinvestment risk are present for a stock investment as well. In this case, however, the dominant risk is that the company could go out of business, leaving its shareholders with nothing. This kind of individual stock risk is largely eliminated with broad diversification. With a sufficiently diversified portfolio, an investor may not even notice if one of the weaker holdings went to zero. For that diversified investor, market risk largely boils down to needing to sell stocks to fund a spending need at an inopportune time, generally, when stock market prices have dipped.
There is a lot going on in the chart below, but I think it does a good job of putting risk and return into perspective. The green bars represent annual returns for the S&P 500 going back to 1971. The blue dots represent the largest decline that occurred within each of those years. The dark blue and light grey horizontal lines represent the average return on the S&P 500 and cash, respectively, since 1971.

Source: Morningstar Direct. Stocks represented by the S&P 500 TR USD Index. Cash represented by the IA SBBI 30 Day Tbill Index. Returns from 1/1/1971 to 11/20/2023. Long-term returns are annualized. Max Intra-year stock decline is based on daily return data.
A few observations from the chart:
- The green bars reveal the stock market has usually delivered a positive return over this period (42/53 years or 79% of the time) and has often delivered a very strong return of 20% or more (20/53 years or 38% of the time).
- Periodically, the market has experienced a loss over the course of a year (11/53 years or 21% of the time), with a few of those drawdowns exceeding -20% (3/53 years or 6% of the time).
- The blue dots reveal that it is normal for the market to experience a period of volatility, even in the strongest years. The average intra-year drawdown during this period was -9.9%. The average drawdown for years where the market return exceeded 20% was -6.2%.
If stocks and cash carried the same long-term expected return, it would not make sense to put up with the constant gyration in stock prices. Investors would rationally opt for the slow and steady return stream offered by cash. To induce investors to deal with the added discomfort and uncertainty, stocks must at least appear to offer a higher expected return. As the previous chart demonstrated, that has, in fact, been the case historically. The dark blue line shows us that the average annualized return on stocks over the 53-year period was 10.7%. The average return on the relatively stable cash alternative was 4.4%. That excess return (referred to as the equity risk premium) is what makes stomaching market volatility so rewarding.
The chart below demonstrates just how powerful the return advantage of stocks over cash can be if allowed to compound for an extended period. It reflects the growth of an initial investment of $10,000 made into each asset class over a period of roughly 30 years. During that time, the cash investment more than doubles to just over $20,000. The value of stocks explodes higher in comparison, growing to a value of over $190,000! Note that realizing that return would have required the investor to be disciplined throughout all the various market gyrations.
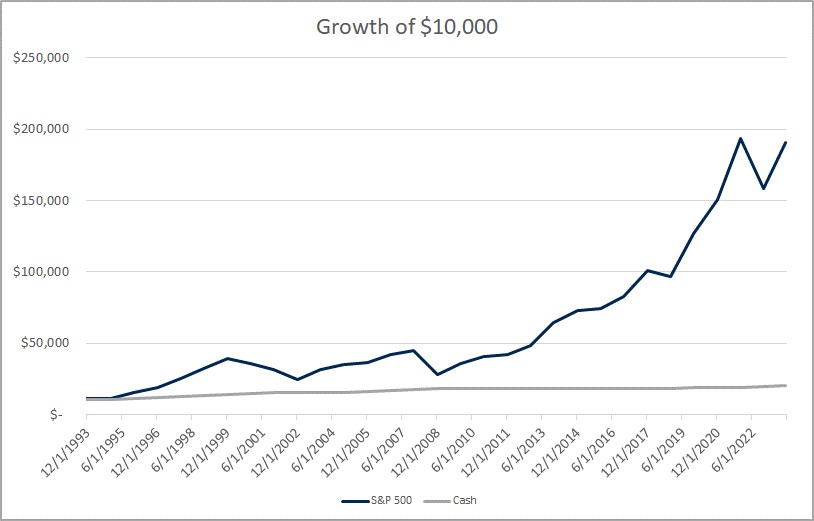
Source: Morningstar Direct. Stocks represented by the S&P 500 TR USD Index. Cash represented by the IA SBBI 30 Day Tbill Index. Chart reflects an initial investment made into each index on 1/1/1993 through 11/20/2023. Returns are compounded annually.
It’s important to keep in mind that 30 years is a long time horizon. Many investors might introduce lower risk/return assets like bonds into their portfolio to dampen volatility as they approach retirement. While a more balanced portfolio of stocks and bonds would have still dramatically outperformed cash, the growth of $10,000 would not have been as extreme as is reflected in the above chart.
Nobody knows exactly what the future will look like. The return charts for the coming decades won’t look exactly like those illustrated above. The ingenuity of people and the incentives provided by capitalism to innovate are what drive the capital markets and the economy forward. I don’t believe those factors are going away. Ultimately, dealing with volatility is uncomfortable, but bearing that discomfort has historically been rewarded over time. Investors who can build a diversified portfolio and stick to it through the market’s gyrations are best positioned to benefit from the wealth-creating power of the capital markets.
1. Kahneman, D., & Tversky, A. (1977). Prospect Theory. An Analysis of Decision Making Under Risk
Week in Review
- Newly released data revealed that existing home sales decreased 4.1% in October from the prior month to a seasonally adjusted annual rate of 3.79 million, the lowest rate since August 2010. On a year-over-year basis, October sales fell 14.6%, and existing home sales for 2023 are on track to be the lowest since 2011.
- The minutes from the 11/1 FOMC meeting were released today, providing insight into how committee members are thinking about interest rate policy going forward. The minutes gave no indication members were even discussing lowering the Fed Funds rate as inflation remains well above their stated objective. Officials commented that monetary policy will need to remain restrictive until the data shows convincing evidence of inflation trending toward their 2% objective, a sentiment Chairman Powell echoed in his post-meeting press conference. The minutes also gave insight into the official’s expectations of Q4 GDP, which they expect to “slow markedly” from the 4.9% increase in Q3.
- According to FactSet, 94% of the S&P 500 has reported Q3 results as of last Friday (11/17). The earnings growth rate, blending companies that have already reported with the estimates for those that have yet to report, is at 4.3% year-over-year. If the blended-rate estimate comes to fruition, it will be the first quarter of year-over-year earnings growth for the S&P 500 since Q3 of 2022. FactSet also released insights into how often “inflation” is cited in earnings calls and found that of the 470 earnings calls conducted between September 15th and November 16th, the term “inflation” was cited by 276 companies, the lowest number of companies citing “inflation” since Q2 of 2021.
Hot Reads
Markets
- The Hidden Hero Fueling Soft Landing Hopes: A Boost in Supply (WSJ)
- The Market Thinks The Fed Is Going To Start Cutting Rates Aggressively. Investors Could Be in for a Letdown (CNBC)
- Wholesale Prices Fell 0.5% in October for Biggest Monthly Drop Since April 2020 (CNBC)
Investing
- Charts That Explain The Stock Market (Ben Carlson)
- Get Your Hands Dirty (Adam Grossman)
- An 8% Retirement Withdrawal Rate (MorningStar)
Other
- Decades of Black Friday Deals: A History of America’s Favorite Shopping Day (WSJ)
- Tiger Woods, Rory McIlroy’s TGL Delayed Until 2025 After Venue’s Roof Collapses Golf Digest)
- 2024 Mustang Dark Horse vs Lotus Emira, BMW M2, Supra, Camaro, Challenger - Ultimate Drag Race (YouTube)
Markets at a Glance
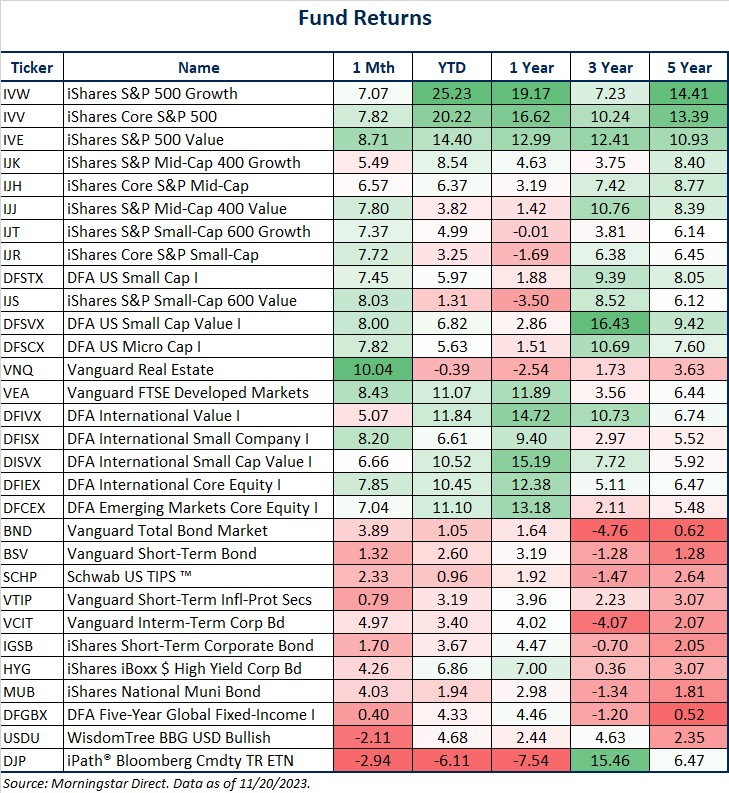

Source: Morningstar Direct.
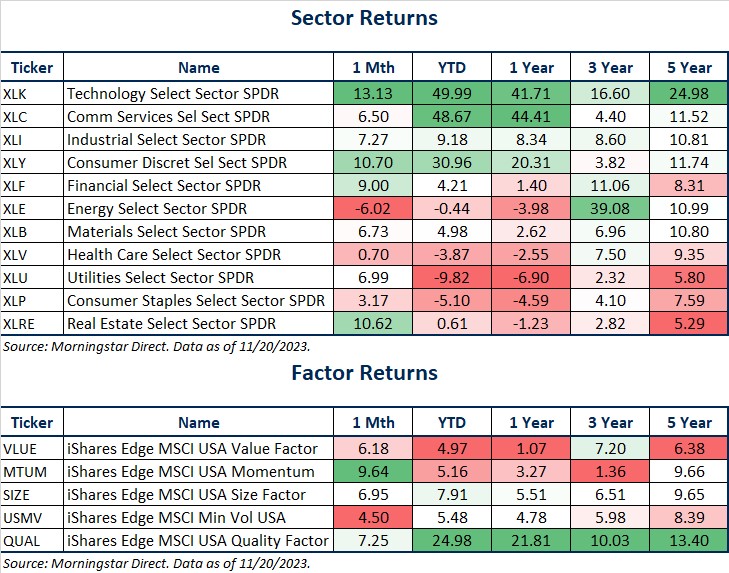
Source: Morningstar Direct.
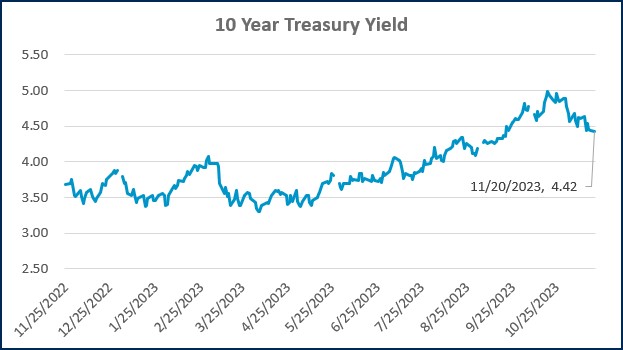
Source: Treasury.gov
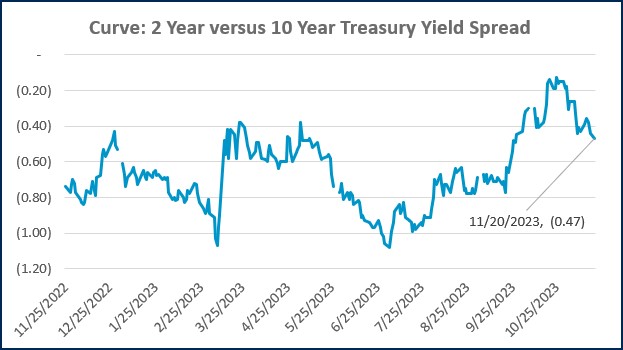
Source: Treasury.gov
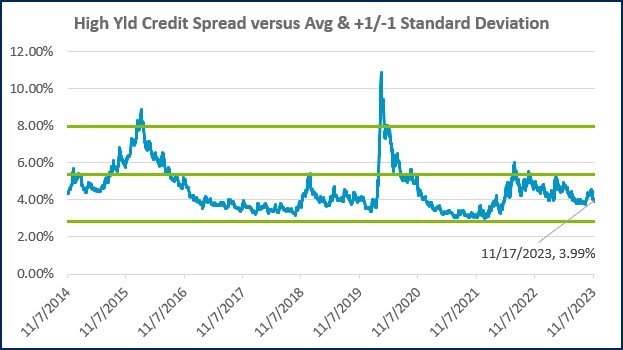
Source: FRED Database & ICE Benchmark Administration Limited (IBA)

Source: FRED Database & ICE Benchmark Administration Limited (IBA)
Economic Calendar
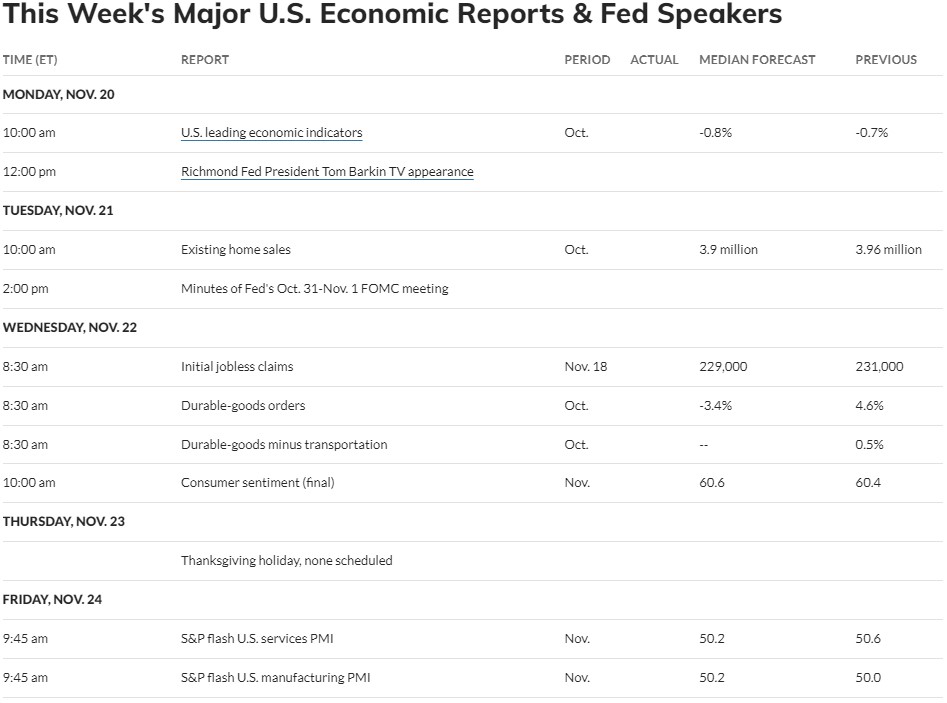
Source: MarketWatch

- Competition, Achiever, Relator, Analytical, Ideation
Josh Jenkins, CFA
Chief Investment Officer, Principal
Josh Jenkins, Chief Investment Officer, began his career in 2010. With a background in investment analysis and portfolio management from his previous roles, he quickly advanced to his current leadership position. As a member of the Lutz Financial Board and Chair of the Investment Committee, he guides Lutz Financial’s investment strategy and helps to manage day-to-day operations.
Leading the investment team, Josh directs research initiatives, while overseeing asset allocation, fund selection, portfolio management, and trading. He authors the weekly Financial Market Update, providing clients with timely insights on market conditions and economic trends. Josh values the analytical nature of his work and the opportunity to collaborate with talented colleagues while continuously expanding his knowledge of the financial markets.
At Lutz, Josh exemplifies the firm’s commitment to maintaining discipline and helping clients navigate market uncertainties with confidence. While staying true to the systematic investment process, he works to keep clients' long-term financial goals at the center of his decision-making.
Josh lives in Omaha, NE. Outside the office, he likes to stay active, travel, and play golf.
Recent News & Insights

QuickBooks
QuickBooks Online Checklist
Is QuickBooks Online right for you? QuickBooks Online can help you better manage your business ...

Accounting
What You Need to Know About the IRS’s CP53E Notices
The IRS has begun issuing CP53E Notices following a recent executive order directing federal ...

Manufacturing
Data-Driven Inventory Management: Using Power BI to Optimize Cash Flow & Financing
Inventory is one of the largest uses of cash for many businesses, yet it’s often managed with ...

Recent News
Duren & Martinson Named Forbes 2026 Best‑in‑State CPAs
Lutz is proud to announce that Mark Duren and Kelly Martinson have been named to the 2026 ...


Let’s get you where you want to go.
We work to simplify complexities, help make critical business decisions, and confidently focus on the things that are truly important to you. We embrace your business as our own to spark the right solutions and help you thrive.