%20(1).jpg?width=264&height=160&name=Website%20Featured%20Content%20Images%20(2)%20(1).jpg)
%20(1).jpg?width=264&height=160&name=Website%20Featured%20Content%20Images%20(4)%20(1).jpg)
-Mar-08-2024-08-50-35-9527-PM.png?width=300&height=175&name=Untitled%20design%20(1)-Mar-08-2024-08-50-35-9527-PM.png)

%20(1)-1.jpg?width=264&height=160&name=Website%20Featured%20Content%20Images%20(2)%20(1)-1.jpg)
-1.jpg?width=264&height=160&name=Website%20Featured%20Content%20Images%20(1)-1.jpg)
%20(1).jpg?width=264&height=160&name=Website%20Featured%20Content%20Images%20(3)%20(1).jpg)


.jpg)


The selloff in the stock market has continued into this week with the S&P 500 falling -16.8% from the January highs as of Monday’s close. The technology-heavy Nasdaq Composite Index has been even more volatile and is down -25.5% over the same period. In light of these painful drawdowns across the stock market, it’s no surprise that investor sentiment is negative. According to a widely followed measure, the pessimistic sentiment has reached extreme levels.
Every Thursday, the American Association of Individual Investors (AAII) publishes a popular sentiment survey. The publication shows how individual investors feel about the short-term prospects of the stock market. While not always meaningful, when the gauge hits an extreme, it’s often an accurate indicator of where things are headed.
The survey began in the late 1980s and is often used by professional investors trying to take the temperature of the market. It asks a simple question: “I feel that the direction of the stock market over the next six months will be…?”
- Up (Bullish)
- No Change (Neutral)
- Down (Bearish)
One common way to analyze and interpret this data is to calculate the spread between the percentage of respondents that are bullish versus those that are bearish. A positive number would generally suggest that investors are optimistic about the future for stock prices, while a negative figure would be indicative of pessimism. The chart below illustrates this sentiment indicator over the last roughly ten years. The middle blue line, which represents the average sentiment level (7.1%), was calculated using data back to the survey’s inception in 1988.
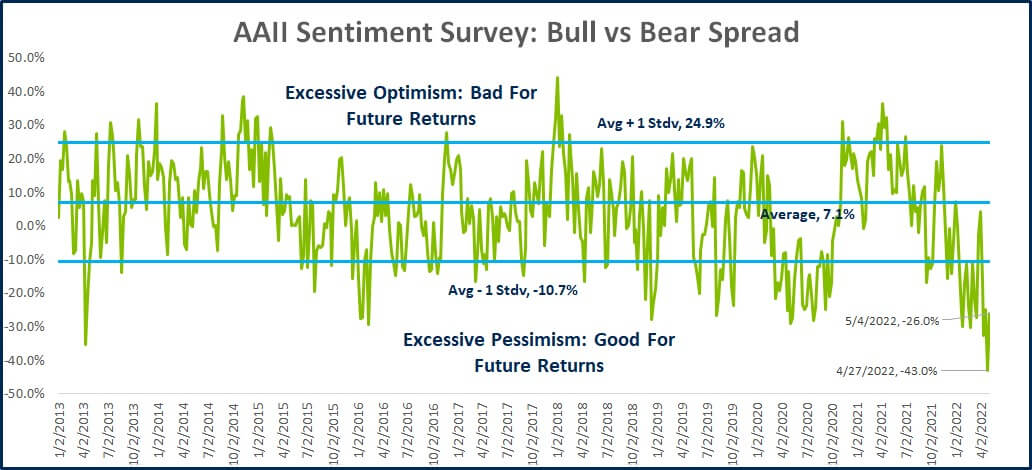
Source: American Association of Individual Investors. Data from 12/31/1987 – 5/4/2022.
This data is very noisy and can ocellate widely from week to week. As a result, the usefulness of the survey results is often low. It becomes relevant, however, when it reaches an extreme level, which we highlight on the chart with the top and bottom blue lines.
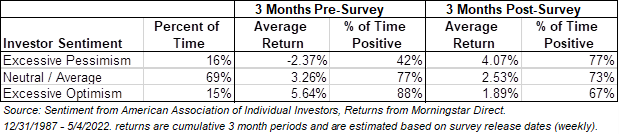
The table below summarizes how the market has performed in the three months before and after each survey since its inception. There are two important takeaways:
- Investor sentiment typically reflects what has just happened. High pessimism typically followed periods where the market had negative performance, while high optimism followed periods where the market had above-average performance.
- When sentiment hits an extreme level, the market tends to reverse. Excessive pessimism has often been followed by above-average returns, while excessive optimism is typically followed by below-average returns.
The results from a recent survey revealed that 16% of investors were bullish, while 59% were bearish (-43% spread). Not only did that survey suggest sentiment had reached extremely pessimistic levels, it was the lowest reading over the last ten years. It is amazing to think that sentiment was higher during the depths of the Covid selloff in early 2020. In fact, you would have to go all the way back to early March of 2009, just days before the stock market bottomed from the Financial Crisis, to find a more pessimistic sentiment reading. As it turns out, that would have been a phenomenal day to invest.
Unfortunately, no indicator can inform investors precisely when a steep selloff is going to end. Assets have declined substantially to reflect a world with higher inflation, tighter monetary policy and increased geopolitical uncertainty. It’s possible the repricing is near the final stage, but investors should brace for the possibility we have further to go. On the bright side, historical evidence demonstrates that when investor sentiment reaches an extreme, the market tends to reverse course.
Fear is clearly the dominant emotion among investors today. When I consider how I should feel about where we stand, I’m reminded of the famous quote from Warren Buffett:
“We simply attempt to be fearful when others are greedy and to be greedy when others are fearful.”
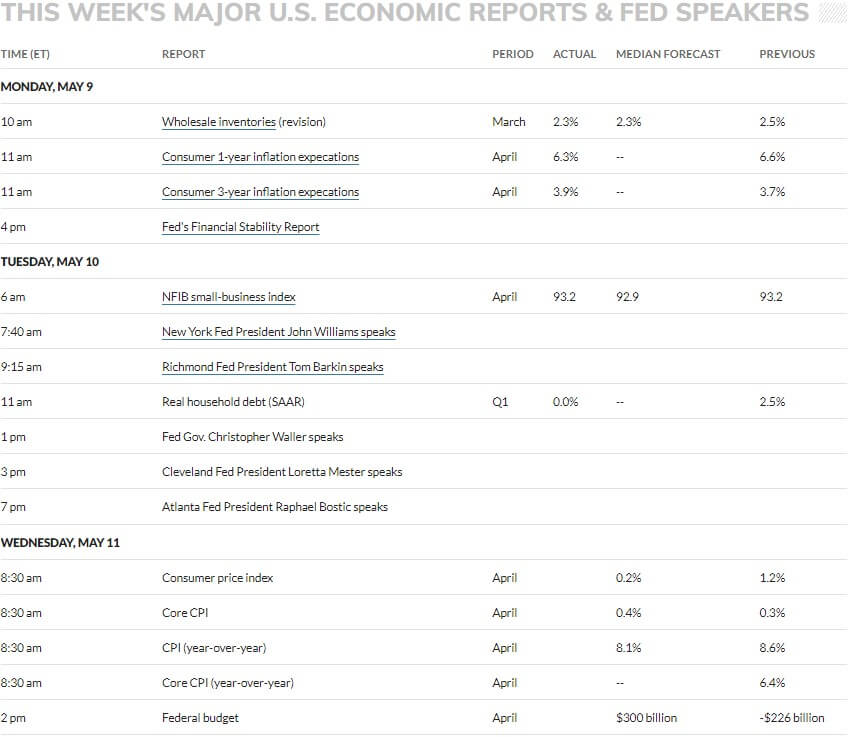
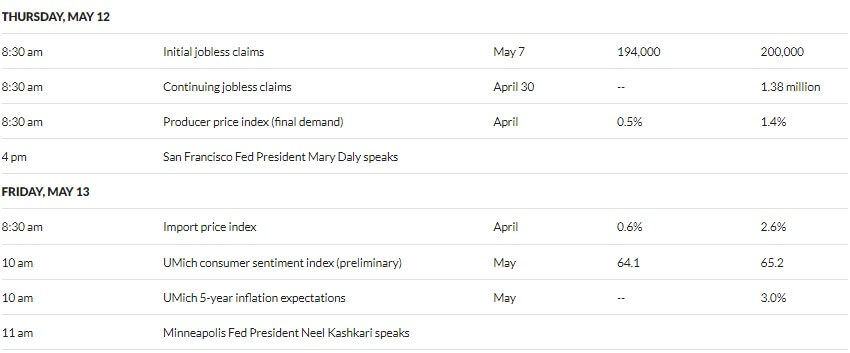
WEEK IN REVIEW
- According to FactSet, 87% of S&P 500 companies have reported earnings for the 1st quarter. Year-over-year earnings growth for companies that have already reported, blended with the estimates for those yet to report, has been 9.1%. Initial earnings estimates for the quarter was forecast to be 4.6%,
- Last week the Bureau of Labor Statistics (BLS) published the payrolls report. The data showed the economy added a robust 428k jobs during April. The unemployment rate remained at 3.6%, while the labor force participation rate declined to 62.2%.
- The latest Consumer Price Index (CPI) data will be published on Wednesday and will headline the economic data releases for the week. According to MarketWatch, headline CPI is expected to decline to 8.1% year-over-year from 8.6% last month. Some of that decline relates more to the high reading of the comparison period 12 months ago. The month-over-month change in inflation is actually expected to accelerate from 0.3% to 0.4%.
ECONOMIC CALENDAR
Source: MarketWatch
HOT READS
Markets
- Inflation Outlook for Consumers Falls From Record High, Fed Survey Shows (CNBC)
- Payroll Growth Accelerated By 428,000 in April, More Than Expected as Jobs Picture Stays Strong (CNBC)
- How the Inflation Rate is Measured: 477 Government Workers at Grocery Stores (WSJ)
Investing
- It’s The Worst Bond Market Since 1842. That’s the Good News. (Jason Zweig)
- A Few Beliefs (Morgan Housel)
- How Long Do Bear Markets last? (Ben Carlson)
Other
- If You’re Paying for College, Watch This Week’s Treasury Auction (WSJ)
- The Coup in the Kremlin (Foreign Affairs)
- The NCAA Approval of NIL Guidelines Signals a Crackdown on Boosters Could be Coming (Sports Illustrated)
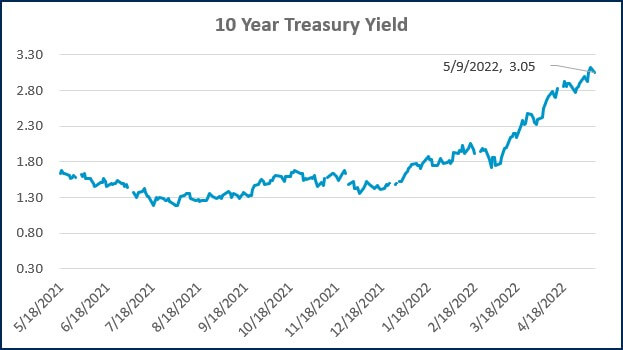
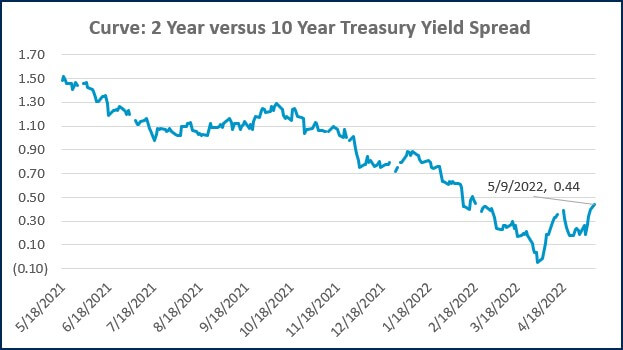
MARKETS AT A GLANCE
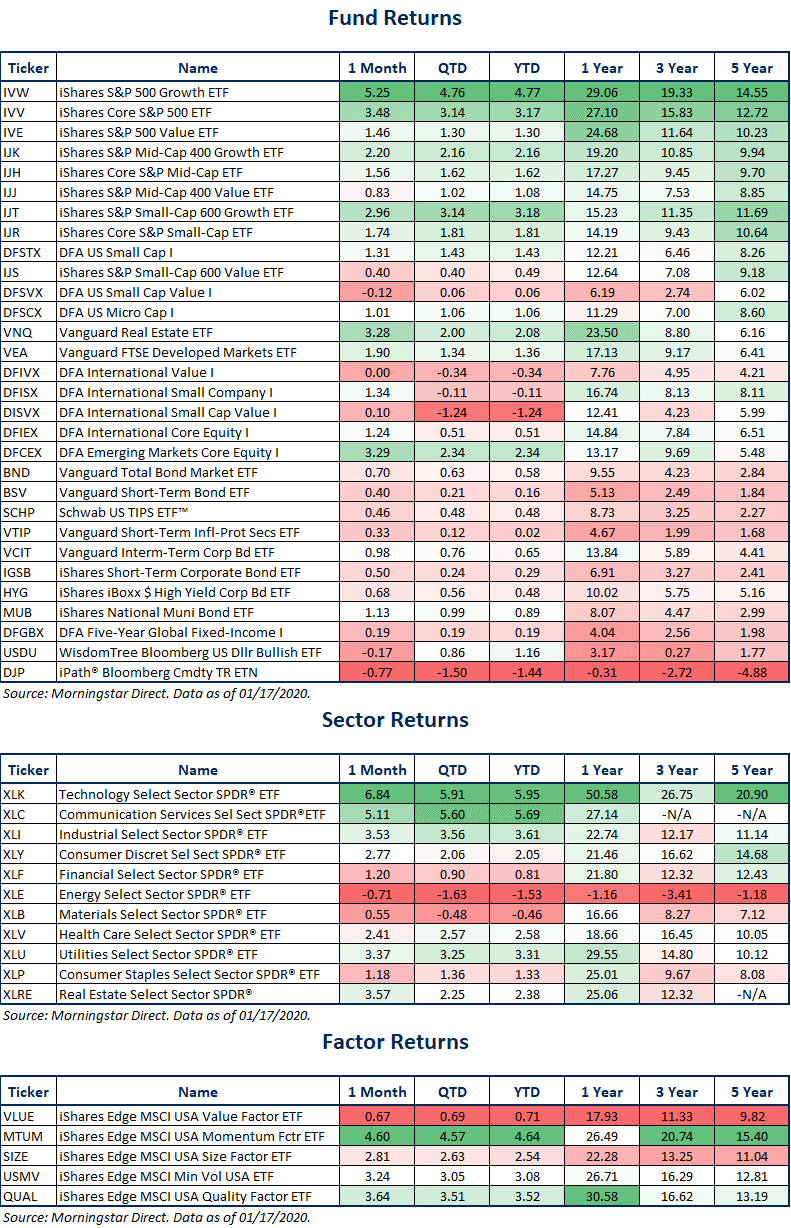
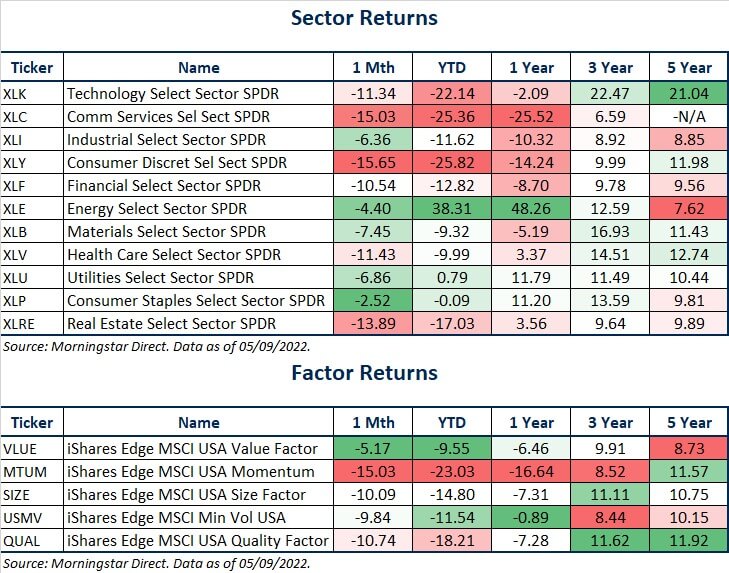
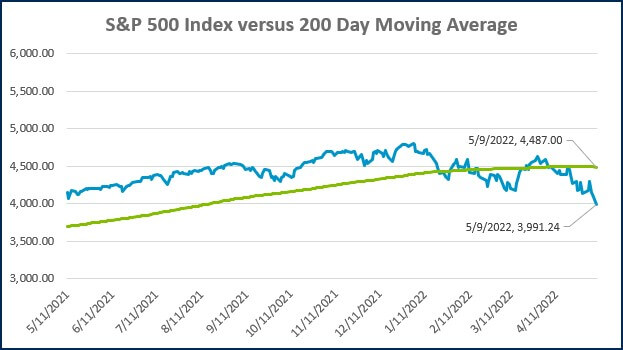
Source: Morningstar Direct.
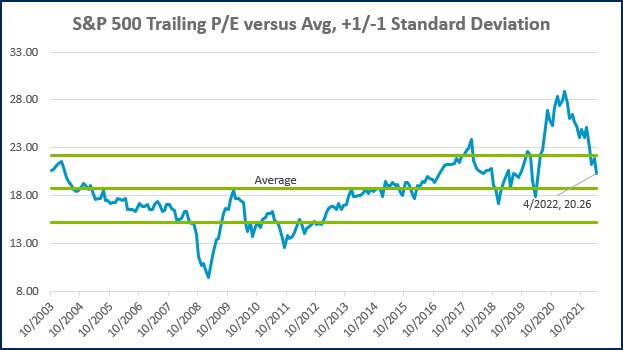
Source: Morningstar Direct.
Source: Treasury.gov
Source: Treasury.gov
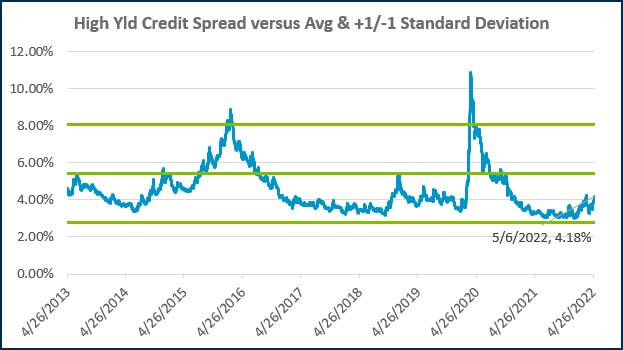
Source: FRED Database & ICE Benchmark Administration Limited (IBA)
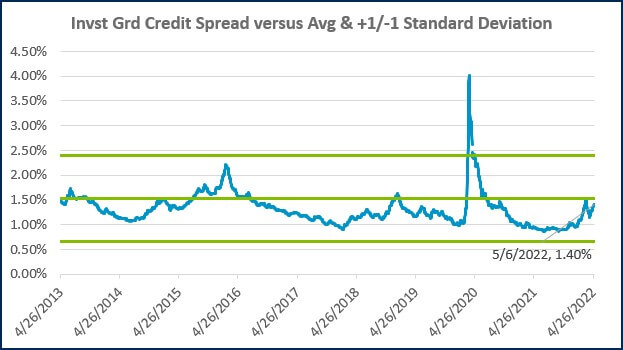
Source: FRED Database & ICE Benchmark Administration Limited (IBA)

- Competition, Achiever, Relator, Analytical, Ideation
Josh Jenkins, CFA
Josh Jenkins, Chief Investment Officer, began his career in 2010. With a background in investment analysis and portfolio management from his previous roles, he quickly advanced to his current leadership position. As a member of the Lutz Financial Board and Chair of the Investment Committee, he guides Lutz Financial’s investment strategy and helps to manage day-to-day operations.
Leading the investment team, Josh directs research initiatives, while overseeing asset allocation, fund selection, portfolio management, and trading. He authors the weekly Financial Market Update, providing clients with timely insights on market conditions and economic trends. Josh values the analytical nature of his work and the opportunity to collaborate with talented colleagues while continuously expanding his knowledge of the financial markets.
At Lutz, Josh exemplifies the firm’s commitment to maintaining discipline and helping clients navigate market uncertainties with confidence. While staying true to the systematic investment process, he works to keep clients' long-term financial goals at the center of his decision-making.
Josh lives in Omaha, NE. Outside the office, he likes to stay active, travel, and play golf.
Recent News & Insights

Lutz adds Luce, Scholting, Schmidt, and Troia

Benson Moul Recognized as Grand Island Top 35 Under 35 Honoree

Estate Planning Lessons from the Connelly Case: Avoiding Costly Tax

5 Areas Rural Hospitals Should Evaluate to Improve Financial Performance

