%20(1).jpg?width=264&height=160&name=Website%20Featured%20Content%20Images%20(2)%20(1).jpg)
%20(1).jpg?width=264&height=160&name=Website%20Featured%20Content%20Images%20(4)%20(1).jpg)
-Mar-08-2024-08-50-35-9527-PM.png?width=300&height=175&name=Untitled%20design%20(1)-Mar-08-2024-08-50-35-9527-PM.png)

%20(1)-1.jpg?width=264&height=160&name=Website%20Featured%20Content%20Images%20(2)%20(1)-1.jpg)
-1.jpg?width=264&height=160&name=Website%20Featured%20Content%20Images%20(1)-1.jpg)
%20(1).jpg?width=264&height=160&name=Website%20Featured%20Content%20Images%20(3)%20(1).jpg)


.jpg)


%20(1)-Jun-24-2025-07-32-43-4857-PM.jpg)
Investors have had much to contend with in recent years: the pandemic, spiking inflation, rate hikes, tariffs, partisanship at home, and outright war abroad. The 2020s have certainly not lacked drama thus far. If you feel like the market has been a little crazy during this period, you probably aren’t alone, and you’re definitely not wrong.
One way to quantify that feeling is to count how often the market has made a big move. The chart below does just that, showing the number of days in each decade when the S&P 500 rose or fell by 1% or more. The results speak for themselves.
A Decade Worth of Volatility in the 2020s

Source: awealthofcommonsense.com
We’re less than halfway through the 2020s, and we’ve already seen more large single-day moves (440) than we saw in all the 1950s or 60s. In fact, we are nearing the average total (507) and are on pace to become the most volatile decade. Only the 2000s, a period that saw the 9/11 attacks, the last two major US ground wars, the bursting of the technology bubble, and the Great Financial Crisis, seems to have a shot at staying ahead.
Surprisingly, the elevated volatility does not appear to have dampened returns. The 2020s have delivered average annual gains of 13.8%, well above the long-term average of 11.6% since 1950. That’s a sharp contrast to the 2000s when similar levels of turbulence led to a rare outcome: a full decade where the market finished in the red. That stretch earned the nickname “The Lost Decade.”
For more context, check out the average annualized return for U.S. stocks by decade:
- 1950s: 19.4%
- 1960s: 7.8%
- 1970s: 5.9%
- 1980s: 17.5%
- 1990s: 18.2%
- 2000s: -0.9%
- 2010s: 13.6%
- 2020s: 13.8%
Source: Morningstar Direct. Data from 1/1/1950 through 5/31/2025. U.S. stocks represented by the S&P 500 Index.
The 2020s have tested investors' resolve like few periods before. A steady stream of unsettling headlines has triggered repeated calls to retreat from the market. In moments like these, it's easy to believe that this time really is different and that staying invested is a risk not worth taking.
Despite relentless headlines and wild market swings, disciplined investors have been rewarded rather than punished for staying the course. In the moment, staying invested can feel almost negligent, especially when fear is loud and headlines are flashing red. History shows again and again that long-term success is earned not by reacting to volatility but by rising above it. Those who can remain focused on their plan are the ones who ultimately come out ahead.
Week in Review
- Federal Reserve officials voted to keep interest rates steady at the current target range of 4.25% to 4.50% during their meeting on Wednesday, June 18. This marks the fourth consecutive meeting in which the Federal Open Market Committee (FOMC) has held rates unchanged.
- Alongside the decision, the Fed released updated economic projections in its Summary of Economic Projections (SEP), which includes the "dot plot," a chart showing individual FOMC members’ forecasts for the federal funds rate. The median projection for 2025 indicates a total of 50 basis points (0.50%) in rate cuts. There was a notable split among officials, with seven anticipating no rate cuts this year, while eight foresee two 25-basis-point cuts before year-end.
- The latest ISM (Institute for Supply Management) service-sector PMI, a key indicator of economic activity in the services industry, decreased from 51.6 in April to 49.9 in May, signaling the first detraction of the service side of the US Economy in the past 11 months.
Hot Reads
Markets
- The Fed Waits Out the Tariff Economy (WSJ)
- Fed Holds Key Rate Steady, Still Sees Two More Cuts This Year (CNBC)
- Retail Sales Fell 0.9% in May, Worse Than Expected, as Consumers Pull Back (CNBC)
Investing
- Expected Returns in the Stock Market (Ben Carlson)
- Very Bad Advice (Morgan Housel)
- Avoiding Investor FOMO (Adam Grossman)
Other
- Why Omaha is Home of the Men’s College World Series – ESPN Originals (YouTube)
- Our Latest Artificial Intelligence Reports – 60 Minutes (YouTube)
- 3 Simple Wedge Strategies Pros Use From Inside 100 Yards – Golf Digest (YouTube)
Markets at a Glance


Source: Morningstar Direct.

Source: Morningstar Direct.

Source: Treasury.gov

Source: Treasury.gov

Source: FRED Database & ICE Benchmark Administration Limited (IBA)

Source: FRED Database & ICE Benchmark Administration Limited (IBA)
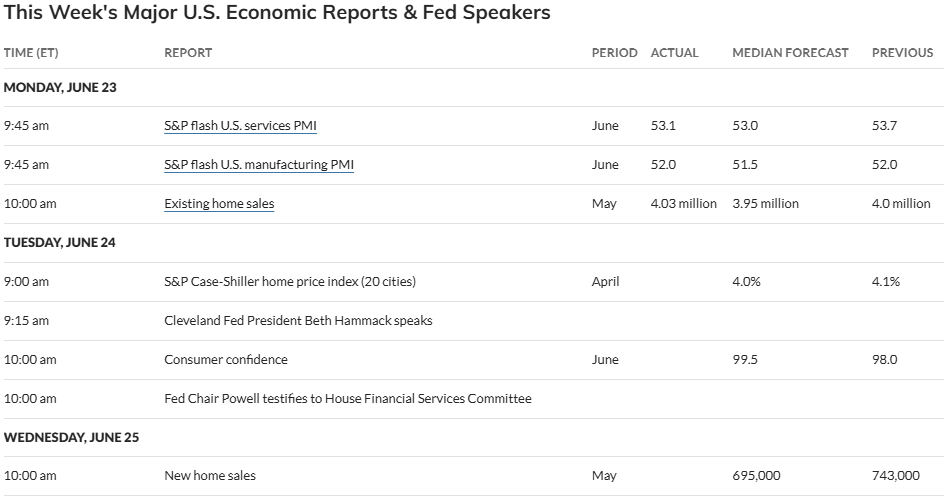
Economic Calendar


- Competition, Achiever, Relator, Analytical, Ideation
Josh Jenkins, CFA
Chief Investment Officer, Principal
Josh Jenkins, Chief Investment Officer, began his career in 2010. With a background in investment analysis and portfolio management from his previous roles, he quickly advanced to his current leadership position. As a member of the Lutz Financial Board and Chair of the Investment Committee, he guides Lutz Financial’s investment strategy and helps to manage day-to-day operations.
Leading the investment team, Josh directs research initiatives, while overseeing asset allocation, fund selection, portfolio management, and trading. He authors the weekly Financial Market Update, providing clients with timely insights on market conditions and economic trends. Josh values the analytical nature of his work and the opportunity to collaborate with talented colleagues while continuously expanding his knowledge of the financial markets.
At Lutz, Josh exemplifies the firm’s commitment to maintaining discipline and helping clients navigate market uncertainties with confidence. While staying true to the systematic investment process, he works to keep clients' long-term financial goals at the center of his decision-making.
Josh lives in Omaha, NE. Outside the office, he likes to stay active, travel, and play golf.
Recent News & Insights

Recent News
Lutz Announces 2026 Shareholder & Director Promotions
Lutz, a Nebraska-based business solutions firm, is proud to announce the promotion of 10 team ...

Nonprofit
Internal Controls for Nonprofit Organizations: Safeguarding Your Mission
Nonprofit organizations operate with a high level of accountability, ensuring every dollar ...

Job Seeker
Career Pivots: How to Identify What Matters Most
Most people don’t follow a perfectly straight career path. Outside of highly specialized ...

Accounting
Trump Accounts: What Families Need to Know
A new savings and investment program called Trump Accounts launched on July 4, 2026, creating ...


Let’s get you where you want to go.
We work to simplify complexities, help make critical business decisions, and confidently focus on the things that are truly important to you. We embrace your business as our own to spark the right solutions and help you thrive.