%20(1).jpg?width=264&height=160&name=Website%20Featured%20Content%20Images%20(2)%20(1).jpg)
%20(1).jpg?width=264&height=160&name=Website%20Featured%20Content%20Images%20(4)%20(1).jpg)
-Mar-08-2024-08-50-35-9527-PM.png?width=300&height=175&name=Untitled%20design%20(1)-Mar-08-2024-08-50-35-9527-PM.png)

%20(1)-1.jpg?width=264&height=160&name=Website%20Featured%20Content%20Images%20(2)%20(1)-1.jpg)
-1.jpg?width=264&height=160&name=Website%20Featured%20Content%20Images%20(1)-1.jpg)
%20(1).jpg?width=264&height=160&name=Website%20Featured%20Content%20Images%20(3)%20(1).jpg)


.jpg)


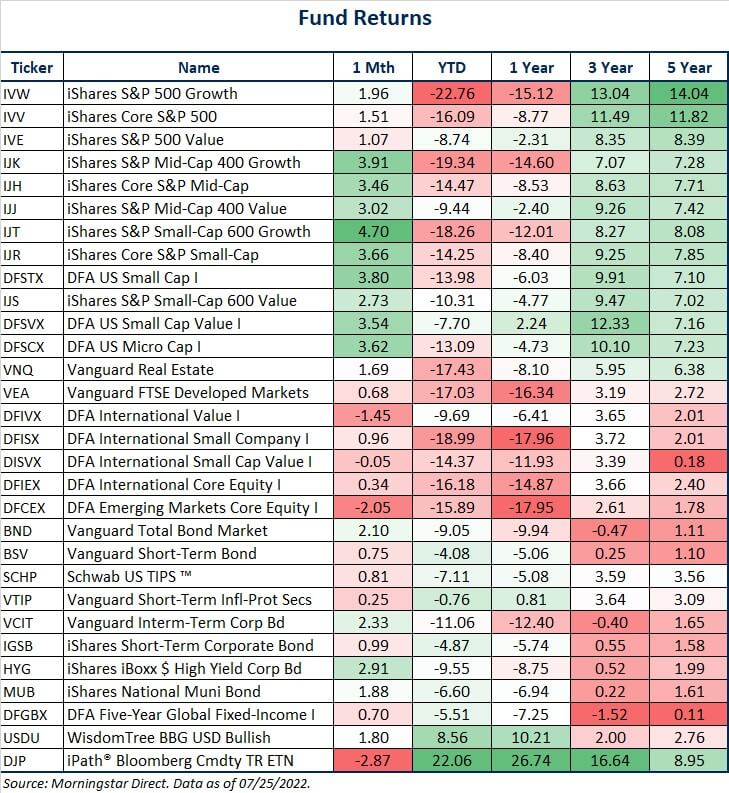
STORY OF THE WEEK
WHAT DOES THE ROUGH START TO THE YEAR MEAN FOR INVESTORS?
The first half of 2022 was unpleasant for investors, to say the least, with the S&P 500 down a painful 19.96%. In fact, over the last 95 years, the stock market has gotten off to a worse start just twice. The financial media wasted no time hyping up this fact, of course. After all, stirring up fear is a tried-and-true way to attract eyeballs. How should investors feel entering the second half of the year? Does a challenging first half of the year doom us to a rough second half as well?
To answer this question, we looked at the US stock market’s performance going all the way back to 1927. During those 95 years, the stock market experienced a negative return during the first six months on 31 occasions. The table below illustrates these negative six-month returns, ranked from largest to smallest, along with the market’s return during the second half of that year.
U.S. Stock Performance Following a Negative 1st Half
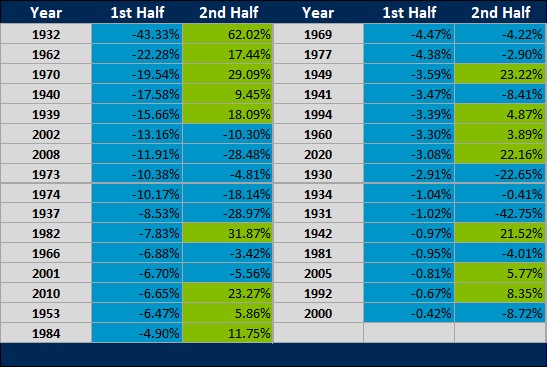
Source: Morningstar Direct. U.S. Stock Market Returns were based on the IA SBBI Large Cap US Index. All returns are cumulative and include data from Jan 1927 through June 2022.
This data demonstrates that simply knowing what happened in the first six months of any given year tells us very little about what might happen during the second half. Of the 31 years where the market started off negative, performance during the second half of the year was pretty much evenly split. Stocks had a positive return over the following six months on 16 occasions, while they continued to fall during the other 15. Overall, the average return in the second half of the year following a loss in the first half was a positive 3.4%. If we looked at the five worst starts to a year, which roughly equates to the market starting down 15% or more, the market finished the year positive every time.
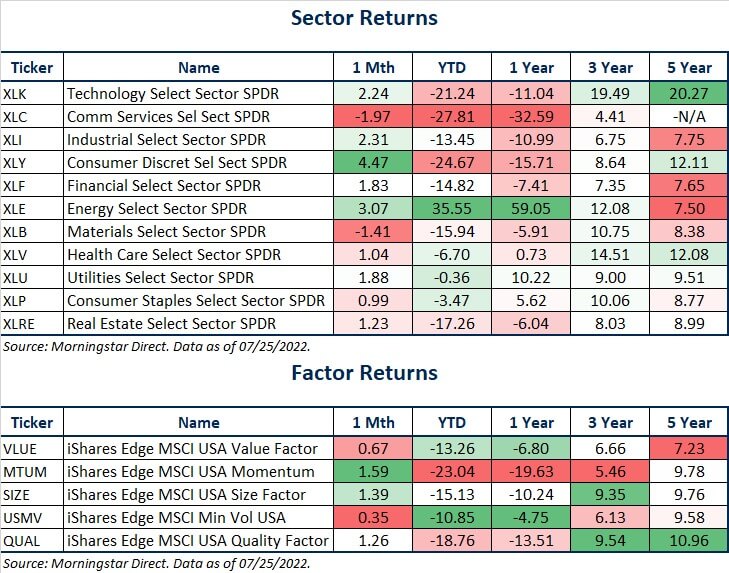
The graph below illustrates this idea in a different way. Performance for each of the 95 years analyzed is included, with the first half return plotted horizontally and the second half return plotted vertically. If there were a strong relationship in the data, the dots would form a visible pattern. Instead, the data points appear to cluster randomly, forming a shapeless jumble.
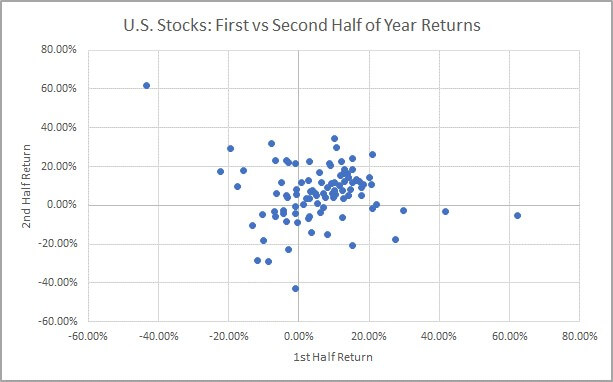
Source: Morningstar Direct. U.S. Stock Market Returns were based on the IA SBBI Large Cap US Index. All returns are cumulative and include data from Jan 1927 through June 2022.
The main takeaway for investors is that despite the rough start to the year, continued poor performance is not assured. Though, it can’t be ruled out either. Fortunately, a substantial amount of bad news is already being priced into the market. As a result, valuations have fallen from elevated levels, improving expected returns moving forward.
WEEK IN REVIEW
- The second quarter earnings season is in full swing, with 21% of S&P 500 companies having reported results according to FactSet. The blended earnings growth rate, using actual data from companies that have reported and expectations for those that have yet to report, has increased to 4.8%. Entering earnings season, earnings were expected to increase by 4.0%.
- On Wednesday (7/27), the Federal Reserve will conclude its monetary policy meeting. The market is currently expecting a 0.75% hike, which will bring the federal funds rate up to 2.25% to 2.50%. This expected rate would match the height of the last hiking cycle, which peaked in 2018.
- It is a busy week for economic data. On Wednesday, we will get durable goods orders and pending home sales. On Thursday, we will get the first look at Q2 GDP and initial jobless claims. Finally, on Friday, we will get the University of Michigan consumer sentiment index and inflation expectations, as well as personal consumption expenditures (PCE), which is the Federal Reserve’s preferred measure of inflation.
LFS BLOG
- Investor Do’s and Don’ts During a Bear Market
- Why Investors Should Own International Stocks
- 3 Things All Investors Should Know
ECONOMIC CALENDAR
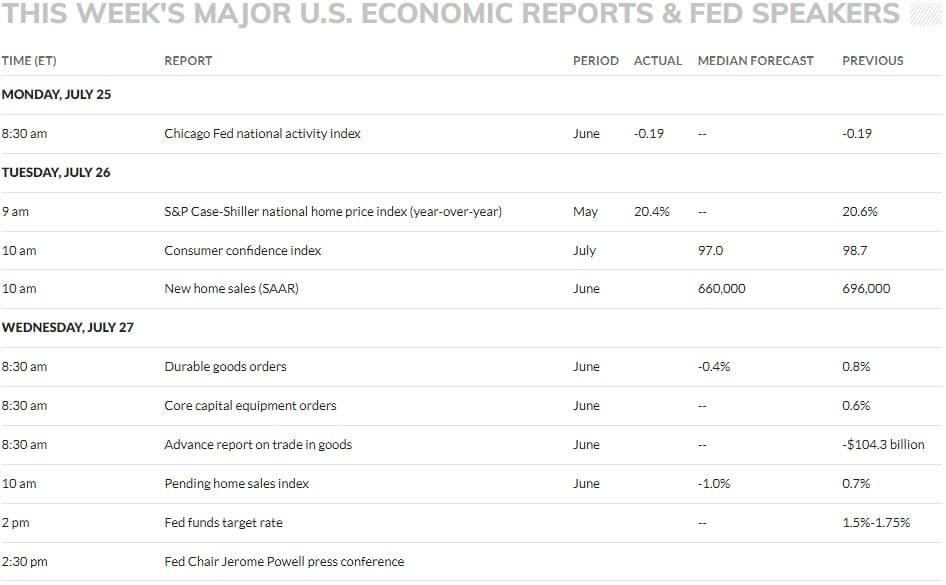
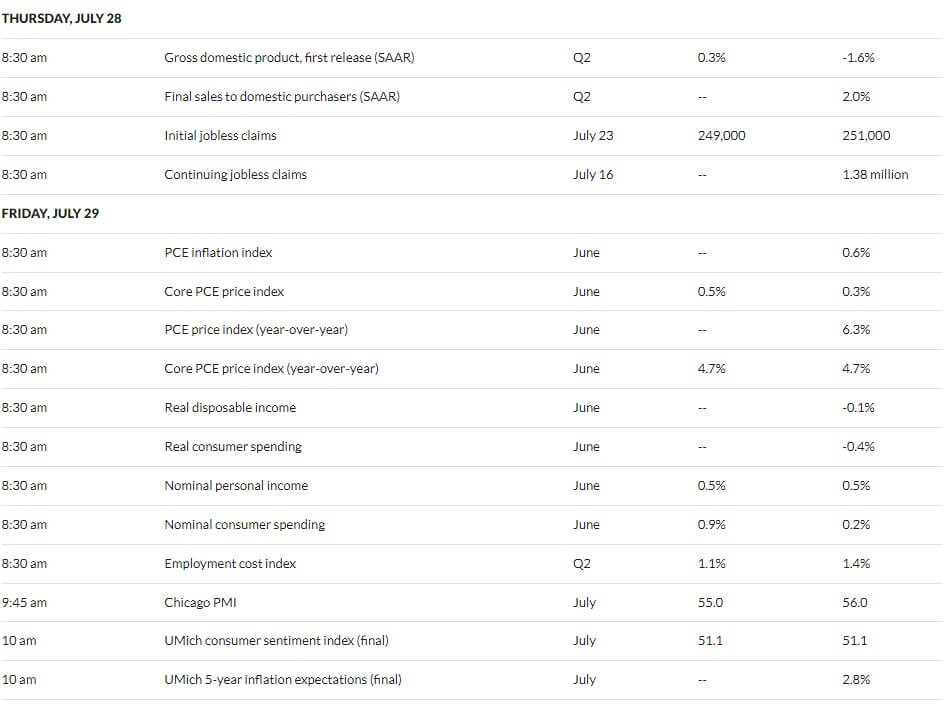
Source: MarketWatch
HOT READS
Markets
- West Coast Ports Reduce Idling Vessels as Container Supply Increases (CNBC)
- Why a Strong Dollar is a Double-Edged Sword for the U.S. Economy (WSJ) Video
- Jobless Claims Rise Again in Another Sign that Labor Market is Cooling (CNBC)
Investing
- Little Ways the World Works (Morgan Housel)
- A Giant Distraction to the Business of Investing (Ben Carlson)
- There Will Always Be Sorcerers (Nick Maggiulli)
Other
- Scan Your Shopping Cart With Yuka and Make Healthier Choices (Wired)
- New Phase of Matter Opens Portal to Extra Time Dimension (Scientific American)
- Have Better Conversations With Friends – Or Anyone (WSJ)
MARKETS AT A GLANCE
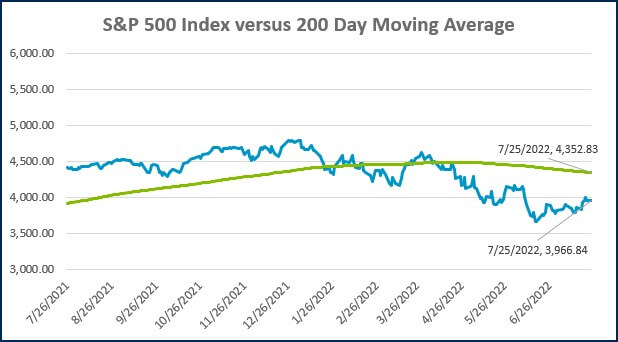
Source: Morningstar Direct.
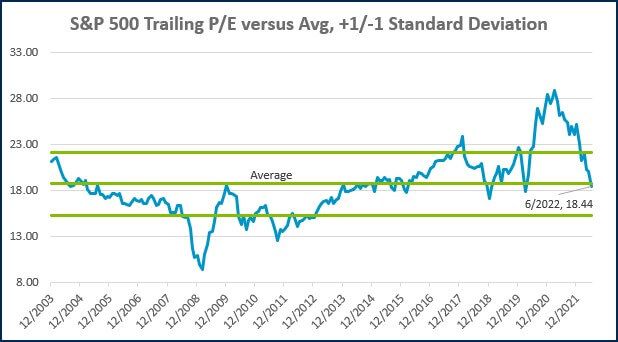
Source: Morningstar Direct.
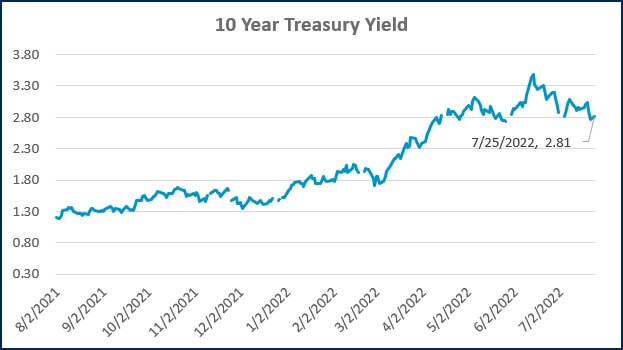
Source: Treasury.gov
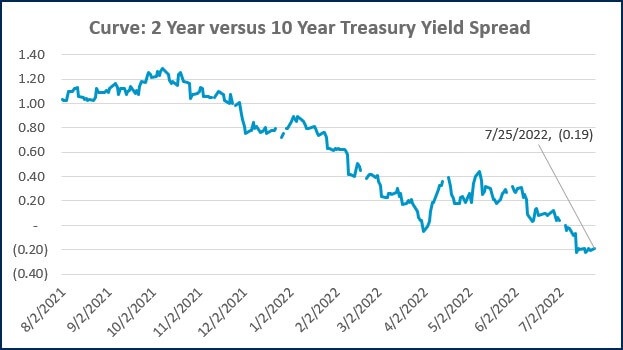
Source: Treasury.gov
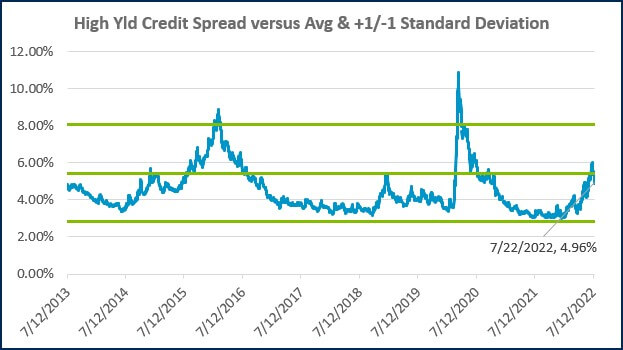
Source: FRED Database & ICE Benchmark Administration Limited (IBA)
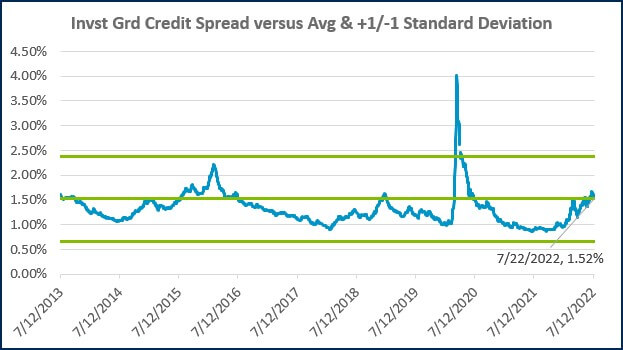
Source: FRED Database & ICE Benchmark Administration Limited (IBA)

- Competition, Achiever, Relator, Analytical, Ideation
Josh Jenkins, CFA
Josh Jenkins, Chief Investment Officer, began his career in 2010. With a background in investment analysis and portfolio management from his previous roles, he quickly advanced to his current leadership position. As a member of the Lutz Financial Board and Chair of the Investment Committee, he guides Lutz Financial’s investment strategy and helps to manage day-to-day operations.
Leading the investment team, Josh directs research initiatives, while overseeing asset allocation, fund selection, portfolio management, and trading. He authors the weekly Financial Market Update, providing clients with timely insights on market conditions and economic trends. Josh values the analytical nature of his work and the opportunity to collaborate with talented colleagues while continuously expanding his knowledge of the financial markets.
At Lutz, Josh exemplifies the firm’s commitment to maintaining discipline and helping clients navigate market uncertainties with confidence. While staying true to the systematic investment process, he works to keep clients' long-term financial goals at the center of his decision-making.
Josh lives in Omaha, NE. Outside the office, he likes to stay active, travel, and play golf.
Recent News & Insights

Lutz Announces 2026 Shareholder & Director Promotions

Internal Controls for Nonprofit Organizations: Safeguarding Your Mission

Career Pivots: How to Identify What Matters Most

Trump Accounts: What Families Need to Know

