%20(1).jpg?width=264&height=160&name=Website%20Featured%20Content%20Images%20(2)%20(1).jpg)
%20(1).jpg?width=300&height=175&name=Mega%20Menu%20Image%20(2)%20(1).jpg)
%20(1)-Mar-08-2024-09-27-14-7268-PM.jpg?width=300&height=175&name=Untitled%20design%20(6)%20(1)-Mar-08-2024-09-27-14-7268-PM.jpg)

%20(1)-1.jpg?width=264&height=160&name=Website%20Featured%20Content%20Images%20(2)%20(1)-1.jpg)
-1.jpg?width=264&height=160&name=Website%20Featured%20Content%20Images%20(1)-1.jpg)
%20(1).jpg?width=264&height=160&name=Website%20Featured%20Content%20Images%20(3)%20(1).jpg)
%20(1).jpg?width=264&height=160&name=Website%20Featured%20Content%20Images%20(4)%20(1).jpg)
-Mar-08-2024-08-50-35-9527-PM.png?width=300&height=175&name=Untitled%20design%20(1)-Mar-08-2024-08-50-35-9527-PM.png)


.jpg)


Market sentiment has been as volatile as stock prices in 2018, and there is an abundance of storylines impacting each. Investors spend a significant amount of time fretting over things like trade tensions, interest rates, and inflation, but these macro variables are massively complex and impossible to correctly forecast consistently. To complicate matters further, even if you do make a correct forecast, it doesn’t mean the market will respond in the way you expect. Instead of getting swept up by the narrative of the day, it’s better for investors to focus on what they can control. With this in mind, here are three things all investors should know. 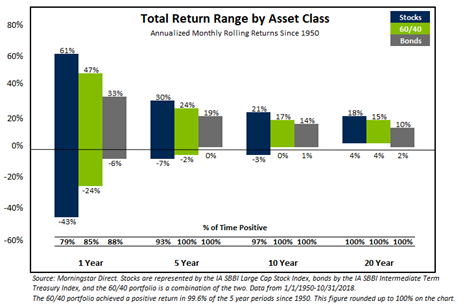
INVESTORS ARE REWARDED OVER TIME
While an investor’s time horizon is not the only factor in determining their ability to take risk, the chart below demonstrates why it is an important one. We can see below the range of returns experienced for stocks, bonds, and a balanced portfolio, defined as a portfolio of 60% stocks and 40% bonds, across various time intervals going back to 1950. A few takeaways include:
- The range of returns is very wide for the one-year window but shrinks as you expand the measurement period.
- The chances of generating a positive return increase as you expand the measurement period.
Investors with a long investment horizon need not care about the day-to-day or even year-to-year gyrations in the market. Looking back on nearly seventy years of history, there has never been a twenty-year period where stocks, bonds, or a balanced portfolio have posted a negative return. I’d add a generic disclaimer: anything is possible in the future, and there is a first time for everything. Even so, this is very impressive, considering the first twenty-year period in the analysis (the twenty years ending January 1950) included the majority of the Great Depression and World War II.
You don’t have to have a twenty-year horizon to participate in the market. Even the intermediate five and ten-year periods have an excellent track record of both bonds and balanced portfolios batting a thousand. While stocks did not perform perfectly, they still delivered a gain of 93% and 97% of the time for the five and ten-year periods, respectively. Interestingly, all of the ten-year losses for stocks were associated with the infamous “lost decade”—the period sandwiched between two extreme and unusual market events: the height of the technology bubble in the late 1990s and the trough of the great recession in the late 2000s.
Though stocks were positive nearly 80% of the time over a one-year window, the wide range of outcomes highlights the importance of liquidity. The portion of the portfolio that needs to be quickly converted into purchasing power should consist of cash and bonds. When this is not the case, an investor risks becoming a forced seller. Volatility alone does not lead to a permanent impairment of capital. Being forced to sell stocks after a downturn does.
MISSING OUT ON A FEW “UP” DAYS CAN DEVASTATE YOUR RETURNS
When volatility picks up in the market, many investors begin to think about selling out of risky assets and waiting in cash for the opportunity to reinvest when things have settled. While this strategy has intuitive appeal, there is a catch: It is virtually impossible to do it profitably.
There are many factors that contribute to the futility of trying to time short-term market movements. Consider the initial sell decision: The desire to migrate to safety is generally associated with recent, and often dramatic, downward market movements. This desire for safety often equates to selling at or around a near-term low… not a good start.
Frequently, these volatile periods do not involve steady price declines that occur in a linear fashion. Rather they are punctuated by violent moves both higher and lower. By way of example, consider October 2008, the worst month for U.S. stocks over the last thirty years. While many people carry visceral memories of that period, few probably recall that on two different occasions that month the market returned over 10% in a single day!
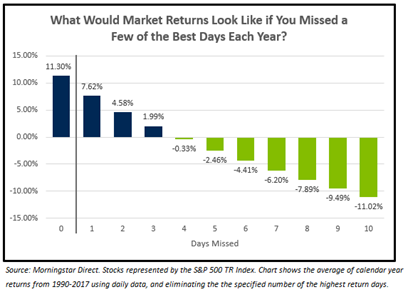
The chart below looks at the average calendar year returns for the S&P 500 from 1990 to 2017, as well as how your investment outcome would change if you missed a few of the largest returning days each year. A buy-and-hold investor would have received an average yearly return of 11.3%, not bad considering this period contains two of the most dramatic market drawdowns in U.S. history. Had you missed the single best day each year, your return would be reduced by a third to 7.6%. Missing four days, your average return becomes negative. Miss ten and stocks would have declined each year an average of -11.0%.
Of course, this is a simple way of looking at things. Presumably, if you sell when prices are declining and that volatility happens to continue, though it often does not, then you may avoid some bad days in addition to the good. A major issue with this method is you still need a trigger to get back into the market, which for many people equates to seeing a recovery in prices. Now you have sold after losses and bought after gains.
On average, the market delivers a gain over just four days during the year and trades sideways the rest of the time. This realization is shocking to many. When viewed from this perspective, the pressure to not miss one of these days is high. Bottom line, don’t try to time the market and voluntarily become a forced seller.
MISSING OUT ON A FEW BIG WINNERS WILL ALSO HURT RETURNS
A similar analysis as the one used above for market timing can be applied to diversification. The idea is straightforward. Investors who choose a concentrated approach to investing face a high degree of pressure to pick the right stocks. Look no further than the explosive growth in index funds to see that picking the winners is no easy task, even for the professionals.
In the absence of decades of index constituent data, I borrowed from a recent Morningstar article(1) and an academic paper(2) focused on the topic. The paper, published by Arizona State University, concluded that concentrated portfolios are likely to underperform the broad market over time. The cause? A small subset of stocks account for the majority of the gains. Sound familiar? The author analyzed returns going back to 1926 and found that roughly 4% of the best-performing stocks accounted for all the wealth generated by the market over time. The other 96% of stocks essentially broke even.
To not own one of these star stocks risks missing out on tremendous gains. In many ways, diversification within your stock allocation is not about limiting the downside risk of any one company. Instead, it’s about maximizing the number of companies where you can participate in the upside.
At the end of the day, your financial success or failure is not going to depend on forecasting macro events. The keys to your success will depend on devising and adhering to a sound financial plan. A good plan will balance near-term spending needs with long-term capital growth or preservation. It will keep you invested, even when doing so is uncomfortable. Finally, it will be diversified, ensuring that you participate in the wealth generated by the next crop of top-performing businesses. If you have any questions, please contact us to learn more.
[1] Bryan, B. (2018, November 28). “Why Diversification Beats Conviction” Retrieved from Morningstar.com
[2] Bessembinder, H. (2017). “Do Stocks Outperform Treasury Bills?” Department of Finance, Arizona State University.

- Competition, Achiever, Relator, Analytical, Ideation
Josh Jenkins, CFA
Josh Jenkins, Chief Investment Officer, began his career in 2010. With a background in investment analysis and portfolio management from his previous roles, he quickly advanced to his current leadership position. As a member of the Lutz Financial Board and Chair of the Investment Committee, he guides Lutz Financial’s investment strategy and helps to manage day-to-day operations.
Leading the investment team, Josh directs research initiatives, while overseeing asset allocation, fund selection, portfolio management, and trading. He authors the weekly Financial Market Update, providing clients with timely insights on market conditions and economic trends. Josh values the analytical nature of his work and the opportunity to collaborate with talented colleagues while continuously expanding his knowledge of the financial markets.
At Lutz, Josh exemplifies the firm’s commitment to maintaining discipline and helping clients navigate market uncertainties with confidence. While staying true to the systematic investment process, he works to keep clients' long-term financial goals at the center of his decision-making.
Josh lives in Omaha, NE. Outside the office, he likes to stay active, travel, and play golf.
Recent News & Insights

QuickBooks Online Checklist

What You Need to Know About the IRS’s CP53E Notices

Data-Driven Inventory Management: Using Power BI to Optimize Cash Flow & Financing

Duren & Martinson Named Forbes 2026 Best‑in‑State CPAs

