What does the election mean for your investments? + 4.02.24

In election years we frequently get questions about how the markets might be impacted by the winning party. Politics can elicit strong emotions. Passion, properly channeled, can lead to major achievements in many aspects of life. When it comes to investing, however, emotion often leads to poor choices and can be detrimental to investment performance.
Depending on which side of the aisle you sit on, the party in power can have a substantial influence on your overall outlook. This is especially true in the realm of investing, where fear might motivate an investor to liquidate a portfolio in anticipation of their preferred candidate losing. The fact that this pattern repeats over each election cycle would suggest this behavior has been rewarded historically. The data suggests otherwise, however.
The chart below illustrates the market performance during the various presidential terms going back to the 1920s. As you can see, there is no apparent relationship between who controls the White House and how the market has performed. Each party has seen negative returns, low returns, and high returns.
The Market and US Presidential Elections
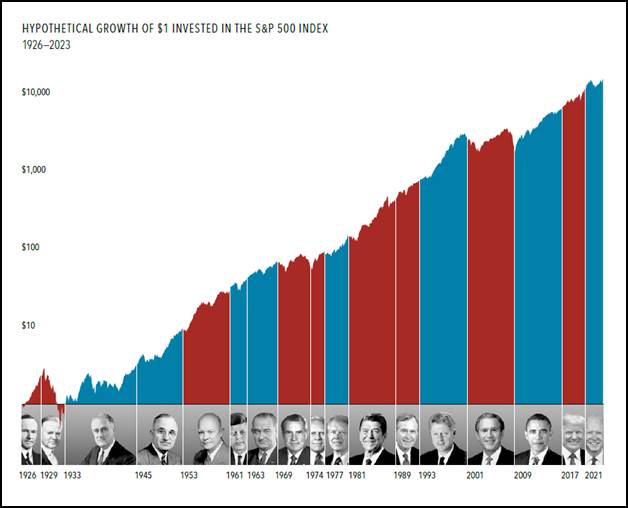
Source: DFA. In USD. Growth of wealth shows the growth of a hypothetical investment of $1 in the securities in the S&P 500 index. S&P data © 2024 S&P Dow Jones Indices LLC, a division of S&P Global. All rights reserved. Data presented in the growth of wealth chart is hypothetical and assumes reinvestment of income and no transaction costs or taxes.
While the President has the power to impact the financial markets and the real economy, it is just one of many variables exerting influence. Global trade, interest rates, inflation, the business cycle, economic conditions outside the U.S., market valuations, war, and pandemics (among countless others) can all significantly influence the trajectory of economic growth and asset prices. Ultimately, entrepreneurship and innovation are the engines that power the U.S. market forward, not the individual occupying the Oval Office.
While there isn’t a way to profitably trade the election outcome consistently, that doesn’t mean the election results might not be accompanied by some market volatility. The market hates uncertainty, and a potential shift toward policies that are considered less favorable for businesses would likely generate volatility. Similar transitions have occurred many times in the past. While there has been heartburn at times as change was initially digested, over time, the market has hardly skipped a beat. Investors have historically been rewarded for taking a long-term view. As the chart illustrates, the market has grown regardless of which party was in control.
Over the next few months, the election is going to dominate the headlines. There will be an endless supply of people trying to predict the future and how to position for it. This is all noise. The best course of action is for investors to separate their politics from their portfolio and focus on their long-term plan. Don’t bet on a Republican win to achieve your financial goals, and don’t bet on the Democrats either. Bet on the millions of small business owners and corporate leaders (including many of our readers) to adapt to any environment and continue to grow. Your portfolio is invested in them, not a political party.
Week in Review
- Last Friday the government published updated Personal Consumption Expenditures (PCE) data, which is the Fed’s preferred measure of inflation. Core PCE, which strips out the volatile food and energy components, rose 0.3% over the last month and 2.8% over the last year, which was in line with economists’ forecasts.
- The latest ISM (Institute for Supply Management) Manufacturing PMI, a gauge for economic activity in the manufacturing sector, increased to 50.3 from 47.8 in February. This marked the first time in 17 months that manufacturing PMI increased above 50 (readings above 50 indicate activity is expanding).
- The yields on 10 and 30-year US Treasuries touched 4.4% and 4.54% respectively today, the highest levels seen since November. The recent high in long-term yields coincided with the Bloomberg Commodity Index also hitting it’s highest level since November as rising oil and gold prices have elevated the index. The 30-year fixed mortgage rate, which tends to track movements in the 10-year Treasury, rose .125% higher today and is now at 7.125%.
Hot Reads
Markets
- Key Fed Inflation Gauge Rose 2.8% Annually in February, as Expected (CNBC)
- Fed’s Favored Inflation Gauge Rose to 2.5% in February (WSJ)
- Inflation Victory Is Proving Elusive, Challenging Central Banks and Markets (WSJ)
Investing
- The Psychologist Who Turned the Investing World on Its Head (Jason Zweig)
- The Most Important Concept in Finance (Ben Carlson)
- Shining Moment – Thoughts on gold after a strong run (Adam Grossman)
- Havana Syndrome Evidence Suggests Who May Be Responsible for Mysterious Brain Injuries – 60 Minutes (YouTube)
- Masters Picks 2024: The Bets We’re Making Right Now for Augusta National (Golf Digest)
- What to Know About Next Week’s Total Solar Eclipse in the US, Mexico and Canada (AP)
Markets at a Glance
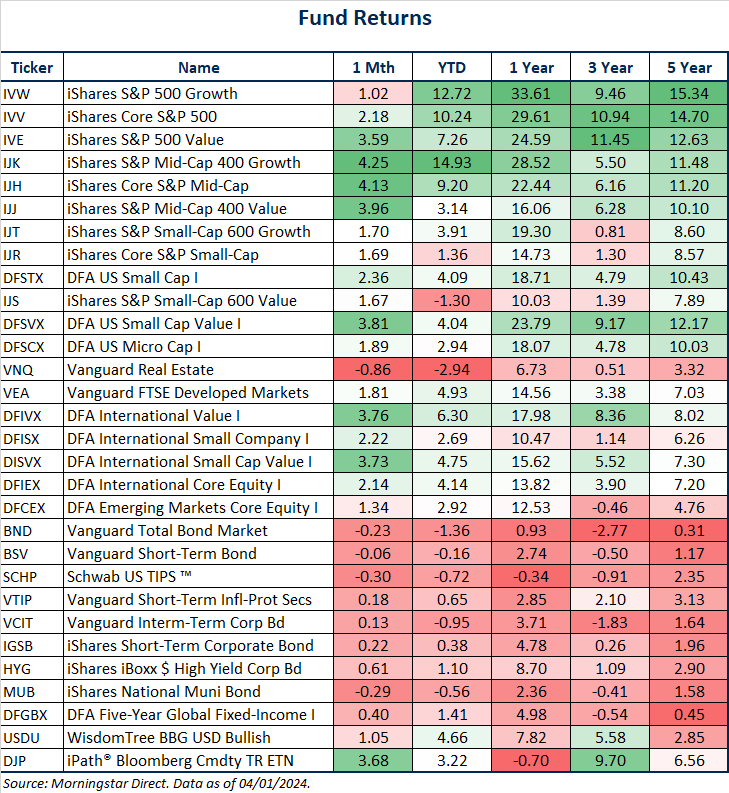
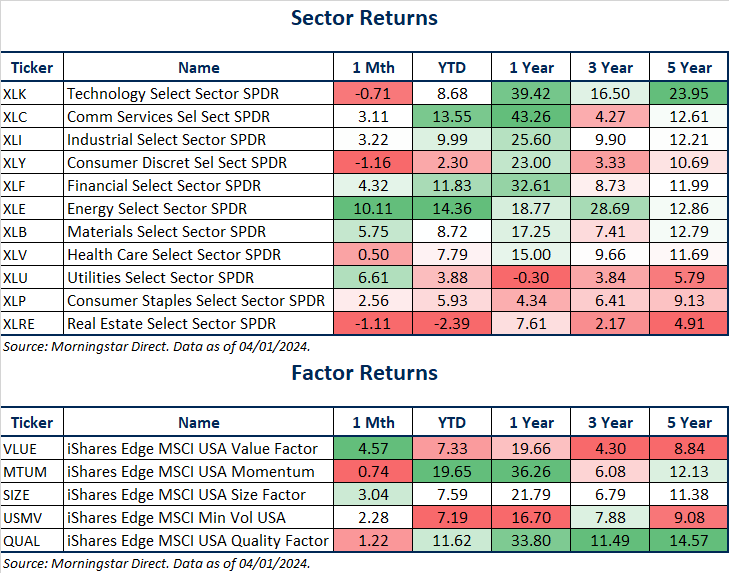
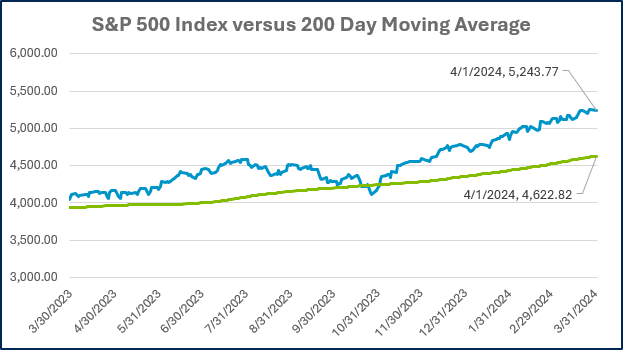
Source: Morningstar Direct.
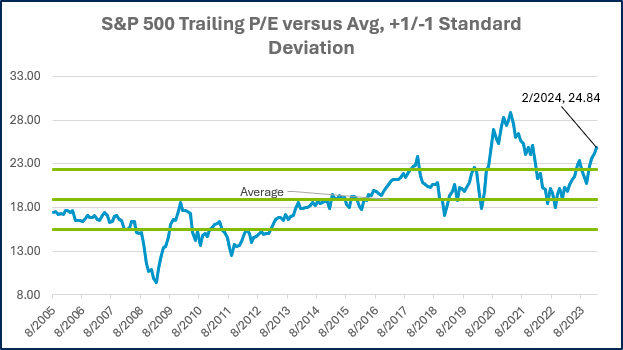
Source: Morningstar Direct.
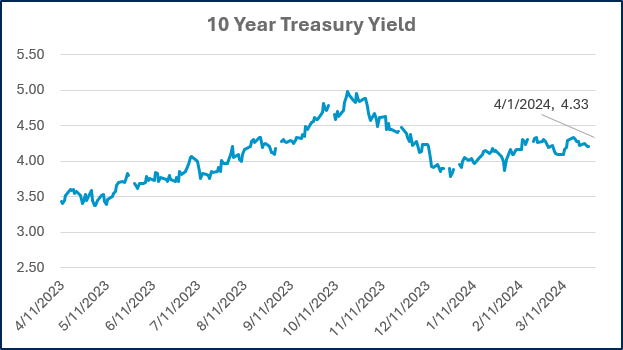
Source: Treasury.gov
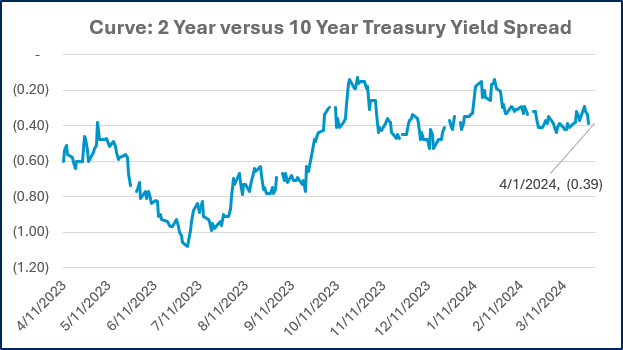
Source: Treasury.gov
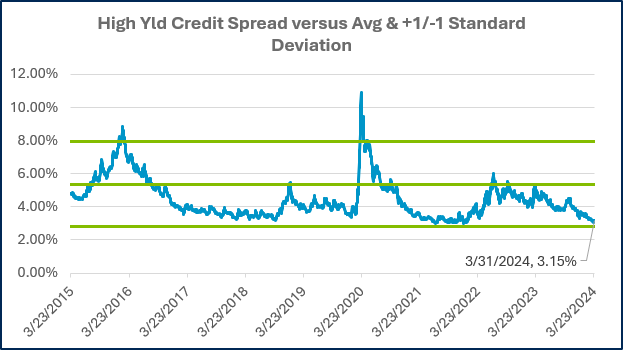
Source: FRED Database & ICE Benchmark Administration Limited (IBA)
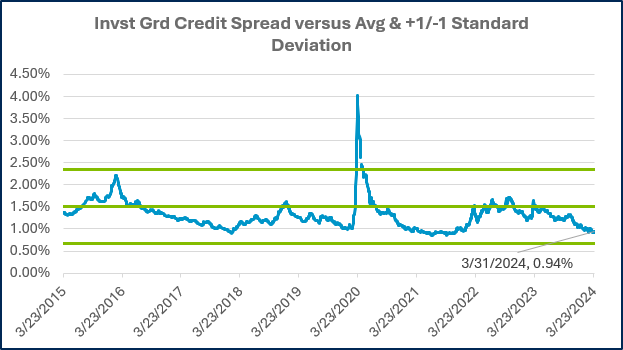
Source: FRED Database & ICE Benchmark Administration Limited (IBA)
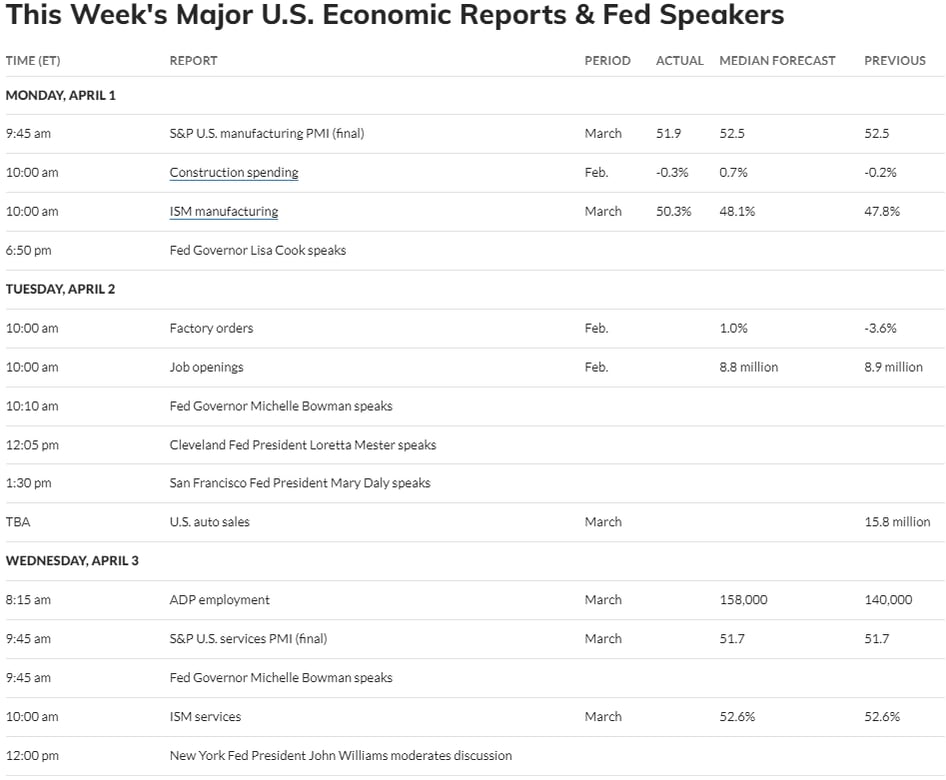
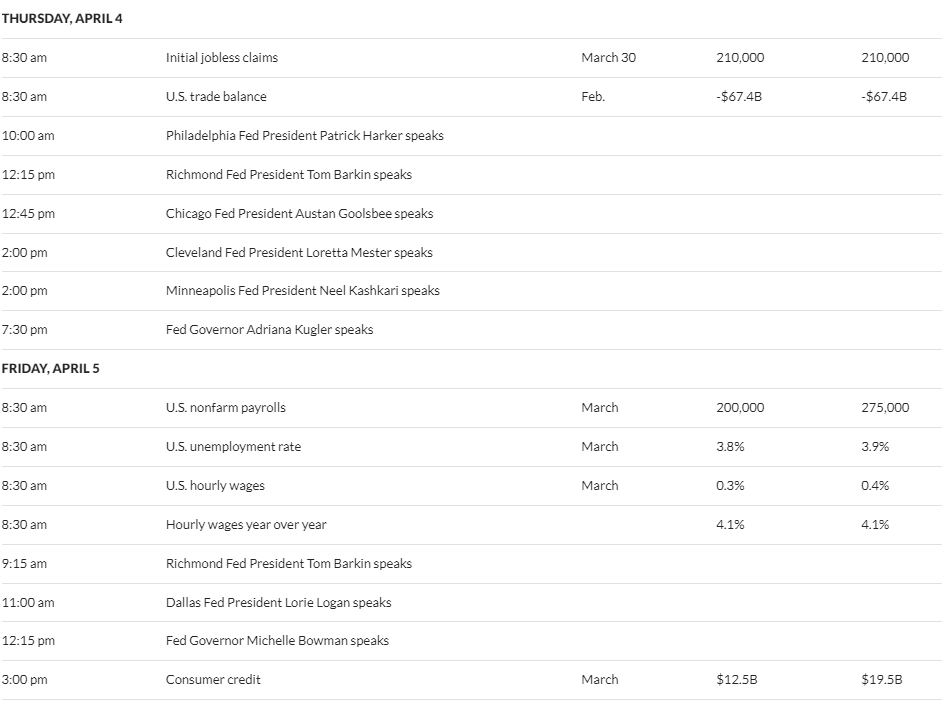
Economic Calendar
Source: MarketWatch

- Competition, Achiever, Relator, Analytical, Ideation
Josh Jenkins, CFA
Josh Jenkins, Chief Investment Officer, began his career in 2010. With a background in investment analysis and portfolio management from his previous roles, he quickly advanced to his current leadership position. As a member of the Lutz Financial Board and Chair of the Investment Committee, he guides Lutz Financial’s investment strategy and helps to manage day-to-day operations.
Leading the investment team, Josh directs research initiatives, while overseeing asset allocation, fund selection, portfolio management, and trading. He authors the weekly Financial Market Update, providing clients with timely insights on market conditions and economic trends. Josh values the analytical nature of his work and the opportunity to collaborate with talented colleagues while continuously expanding his knowledge of the financial markets.
At Lutz, Josh exemplifies the firm’s commitment to maintaining discipline and helping clients navigate market uncertainties with confidence. While staying true to the systematic investment process, he works to keep clients' long-term financial goals at the center of his decision-making.
Josh lives in Omaha, NE. Outside the office, he likes to stay active, travel, and play golf.
Recent News & Insights
Is sales-based apportionment helping or hurting your bottom line?
Employee Stock Ownership Plan (ESOP) Benefits & Best Practices
The 60/40 Portfolio is Alive and Well
International Momentum Continues


%20(1).jpg?width=300&height=175&name=Mega%20Menu%20Image%20(2)%20(1).jpg)
%20(1)-Mar-08-2024-09-27-14-7268-PM.jpg?width=300&height=175&name=Untitled%20design%20(6)%20(1)-Mar-08-2024-09-27-14-7268-PM.jpg)

%20(1)-Mar-08-2024-09-11-30-0067-PM.jpg?width=300&height=175&name=Untitled%20design%20(3)%20(1)-Mar-08-2024-09-11-30-0067-PM.jpg)
%20(1).jpg?width=300&height=175&name=Mega%20Menu%20Image%20(3)%20(1).jpg)
%20(1).jpg?width=300&height=175&name=Mega%20Menu%20Image%20(4)%20(1).jpg)
%20(1).jpg?width=300&height=175&name=Mega%20Menu%20Image%20(5)%20(1).jpg)
-Mar-08-2024-08-50-35-9527-PM.png?width=300&height=175&name=Untitled%20design%20(1)-Mar-08-2024-08-50-35-9527-PM.png)


.jpg)


