%20(1).jpg?width=264&height=160&name=Website%20Featured%20Content%20Images%20(2)%20(1).jpg)
%20(1).jpg?width=300&height=175&name=Mega%20Menu%20Image%20(2)%20(1).jpg)
%20(1)-Mar-08-2024-09-27-14-7268-PM.jpg?width=300&height=175&name=Untitled%20design%20(6)%20(1)-Mar-08-2024-09-27-14-7268-PM.jpg)

%20(1)-1.jpg?width=264&height=160&name=Website%20Featured%20Content%20Images%20(2)%20(1)-1.jpg)
-1.jpg?width=264&height=160&name=Website%20Featured%20Content%20Images%20(1)-1.jpg)
%20(1).jpg?width=264&height=160&name=Website%20Featured%20Content%20Images%20(3)%20(1).jpg)
%20(1).jpg?width=264&height=160&name=Website%20Featured%20Content%20Images%20(4)%20(1).jpg)
-Mar-08-2024-08-50-35-9527-PM.png?width=300&height=175&name=Untitled%20design%20(1)-Mar-08-2024-08-50-35-9527-PM.png)


.jpg)


On January 22, 1993, State Street Global Advisors launched the first U.S. listed Exchange Traded Fund (ETF). The fund, now known as the SPDR S&P 500 ETF Trust (Ticker: SPY), was launched with just $6.5 million in assets and was initially intended to be a niche product utilized by institutional money managers. Like a traditional mutual fund, ETFs allow investors to buy a diversified basket of stocks and/or bonds via a single ticker. ETFs have a few key advantages, however, and in the ensuing decades, this disruptive technology has garnered widespread adoption, forever changing the asset management industry. This week, ETFs celebrate their 30th birthday with over $6.5 trillion in assets.
According to Eric Balchunas, Author of ‘The Institutional ETF Toolbox,’ ETFs were born out of dark times. The original idea was floated following the stock market crash in 1987, where stocks plummeted more than 20% in a single day. Often referred to as ‘Black Monday,’ that drop remains the largest single-day loss in U.S. market history. There were a host of reports and inquiries into what caused the crash. Many of them attribute at least part of the cause to an investment strategy known as ‘portfolio insurance.’ This fad rose to popularity because the stock market had been on an extremely hot streak. After several years of well above-average market performance, investors at the time grew concerned that high valuations would lead to a sell-off.
Portfolio insurance sought to allow institutional asset managers the ability to maintain market exposure while providing downside protection. The strategy involved selling equity index futures contracts if the market declined by a predetermined percentage. The sales of these derivatives would result in trading gains if stock prices continued to fall, thereby providing protection to the portfolio. The more the market dipped, the more equity futures the strategy would sell.
Ultimately, it is believed that portfolio insurance caused a self-reinforcing downward cycle in prices. As the thinking goes, when stock prices fell, the trading algorithms kicked in and sold equity futures. Selling in the futures market caused more downward pressure on stock prices, which spurned more sales of equity futures, which again pushed stocks lower, and so on.
There isn’t a consensus on how much portfolio insurance actually exacerbated the losses on Black Monday. It doesn’t even matter to this story. A 500+ page report authored by the SEC in 1988 believed it was a significant factor(1). Buried deep in the report are a couple of paragraphs that suggest a novel approach to trading baskets of individual stocks. The authors suggested that this sort of basket trading could have acted as a buffer between the futures and stock markets and alleviated some of the downward price pressure that resulted. Enter Nathan Most, a Senior Vice President of Product Development at the American Stock Exchange (AMEX).
At that time, the American Stock Exchange was struggling and lagging behind its rivals, the New York Stock Exchange (NYSE) and Nasdaq(1). To increase trading activity on its exchange, the AMEX took the basket trading idea and ran with it. Most originally took the concept to Vanguard in hopes of partnering with them. Vanguard’s legendary founder, Jack Bogle, declined the opportunity. He did not want investors to be able to rapidly enter and exit his funds. That sort of misbehavior would generate additional costs that would burden Vanguard’s operations, as well as the fund’s remaining shareholders.
Most took Bogle’s feedback and used it to make some design improvements. Specifically, he created the ‘in-kind’ creation and redemption feature. Ultimately, this aspect of the overall design would prove to be the secret sauce that eventually fueled the explosive growth of the ETF industry. AMEX went on to partner with State Street Global Advisors (SSGA) for the launch of the first ETF: SPY.
The creation and redemption process used in ETFs is a little more complicated than it is for traditional mutual funds, but it represents a substantial design improvement. iShares created a short, animated video to help investors visualize how it works. You can check out this link if you would like to learn more:
The Story of ETF Creation and Redemption
The important thing is to understand the key benefits of ETFs, most of which result from the ‘in-kind’ creation and redemption feature.
1. Tax Efficiency: The ‘in-kind’ transfer is not considered a taxable event by the IRS. As a result, ETFs are much less likely to pay out a capital gain at year-end than mutual funds are.
2. Authorized Participants: This feature is not discussed much, but I think it is one of the most important. When mutual fund investors buy and sell, they interact directly with the fund. All costs associated with the trading activity fall on the fund and its shareholders. Investors that generate substantial costs spread those costs to the other shareholders. ETFs utilize a gatekeeper, referred to as an authorized participant (AP). The AP steps between investors and the fund and shields the fund from the activities of those excessively trading. Instead, those trading costs are born by those misbehaving in the form of bid-ask spreads.
3. Low Cost: Like index mutual funds, most ETFs sport low underlying expense ratios. Additionally, ETFs do not pay a kick-back to the selling broker as some mutual funds do.
Asset Weighted Average Expense Ratio(2):
- ETFs: 0.18%
- Mutual Funds: 0.45%
4. Transparency & Diversification: Like mutual funds, ETFs offer investors the ability to diversify globally utilizing a small number of funds. Unlike with mutual funds, ETF investors can observe the holdings of their fund(s) daily. Mutual funds typically produce holdings information quarterly with a lag.
5. Intra-day liquidity: Unlike a mutual fund that can only be transacted once a day after the market closes, ETFs can trade intra-day, much like a stock. While this feature is generally considered a positive, it can lead to bad outcomes if abused by investors.
Ultimately, it took AMEX four years to navigate the regulatory process needed to get SPY launched. In the meantime, the Toronto Stock Exchange took the same idea and launched a version in Canada by 1990, based on the Toronto Stock 35 Index. While technically being the first to market, the Canadian version didn’t survive. It was merged into a different fund in 1999. As a result, SPY is often regarded as the first-ever ETF, or at least the one credited with launching the ETF revolution. Today, SPY has $375 billion in assets and is the most widely traded equity security on the planet.
(1) US Securities and Exchange Commission (SEC). 1988. The October 1987 Market Break: A Report by the Division of Market Regulation, US Securities and Exchange Commission. Washington, DC: US
(2) Data Source: Morningstar Direct as of 1/24/2023. Based on all active US Listed Funds in the Morningstar Direct database.
WEEK IN REVIEW
- Earnings season is in full swing following the end of the fourth quarter. As of last Friday, 11% of S&P 500 companies have reported results. If you blend the earnings growth of companies that have reported with the estimates for those that have yet to report, Q4 earnings growth is on pace to decline by -4.6% year-over-year. Coming into earnings season, the estimated growth rate was -3.2%. Obviously not a great start. Earnings growth is the key to sustainable gains in the stock market. If the earnings growth in Q4 remains negative, it will be the first negative quarter since Q3 of 2020.
- Economic data published last week showed a decline in consumer activity, with retail sales falling more than expected in December. Additionally, producer prices slipped more than expected, and industrial production was also lower than forecast. The one datapoint to show continued strength was the weekly initial jobless claims figures, a proxy for layoffs, which unexpectedly fell to the lowest level in months.
- Economic data to be published this week includes initial jobless claims and durable goods orders on Thursday, followed by the Personal Consumption Expenditures Index (the Fed’s preferred gauge of inflation), consumer sentiment, inflation expectations and pending home sales on Friday.
ECONOMIC CALENDAR
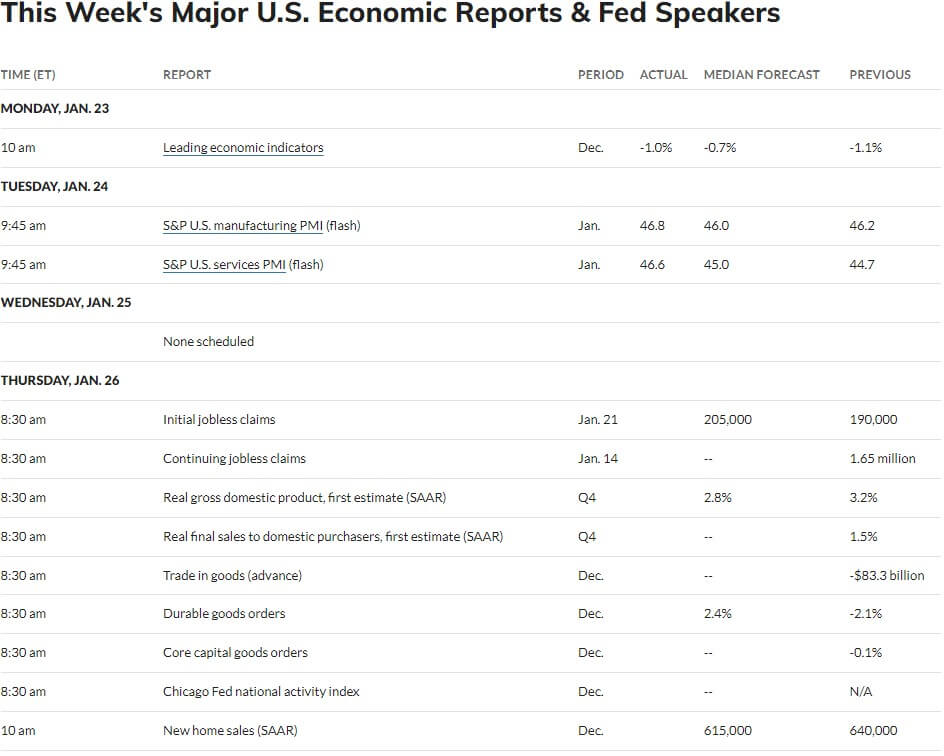
Source: MarketWatch
HOT READS
Markets
- Fed Sets Course for Milder Rate Rise (WSJ)
- DOJ Files Second Antitrust Suit Against Google, Seeks to Break Up Its Add Business (CNBC)
- Wholesale Prices Fell 0.5% in December, Much More than Expected; Retail Sales Fall (CNBC)
Investing
- FOMO: The Worst Financial Trait (Morgan Housel)
- When The Stock Market and Jay Powell Are Frenemies (Jason Zweig)
- Why Invest in Stocks When Bond Yields are Higher (Ben Carlson)
Other
- The Two Common Threads Tying Together the NFC’s Unfamiliar Finalist (SI)
- Nuclear Fusion: Inside the Breakthrough That Could Change Our World (60 Minutes)
- Why We All Need Subtitles Now (Vox)
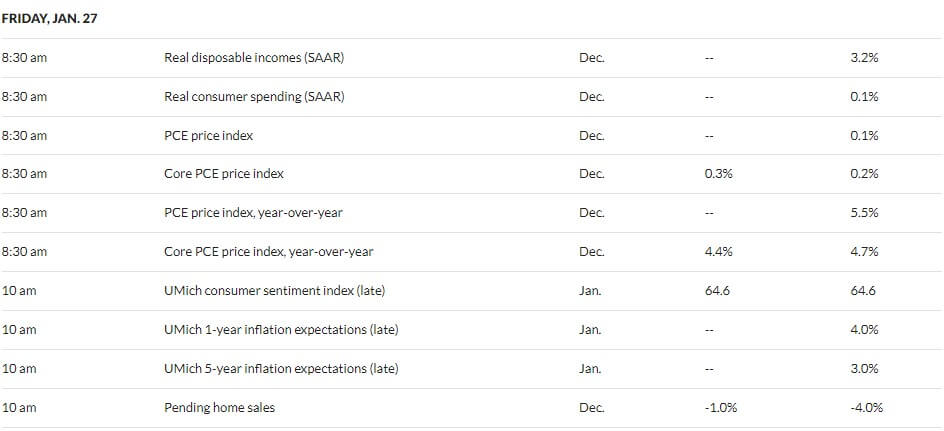
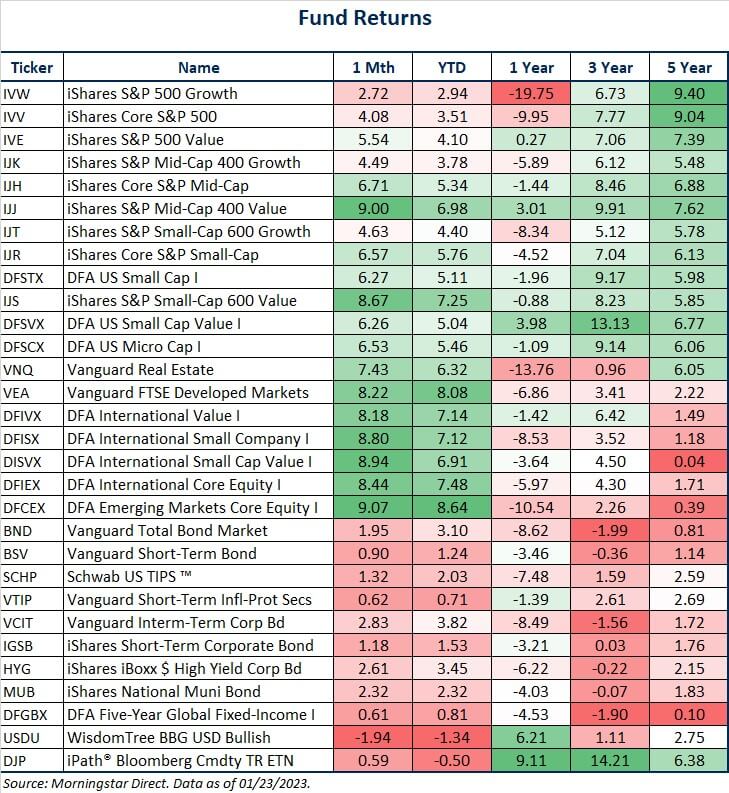
MARKETS AT A GLANCE
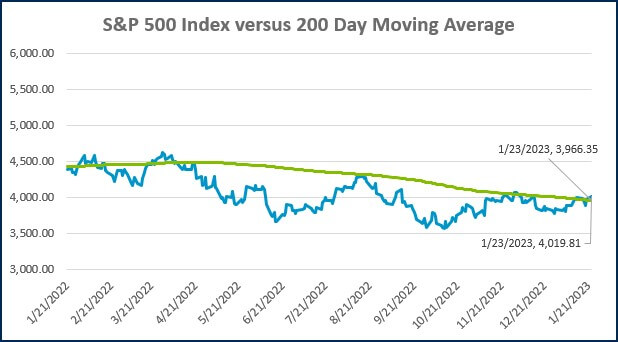
Source: Morningstar Direct.
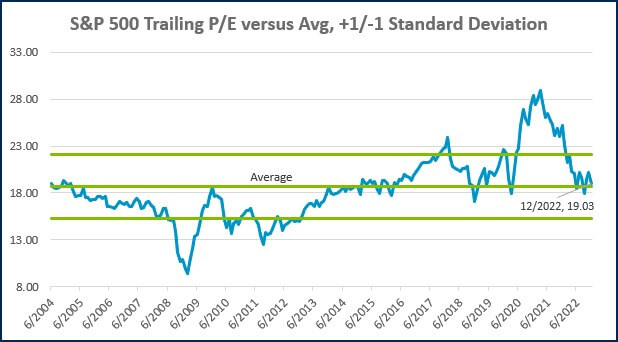
Source: Morningstar Direct.
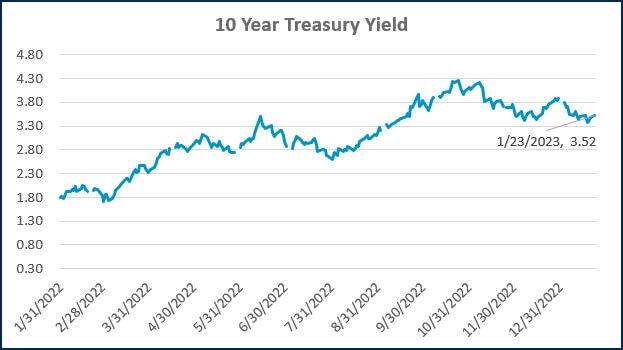
Source: Treasury.gov
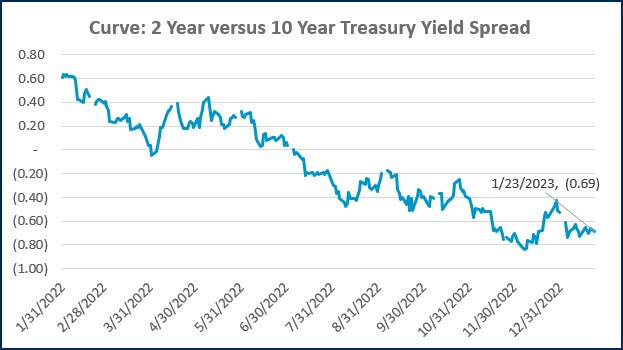
Source: Treasury.gov
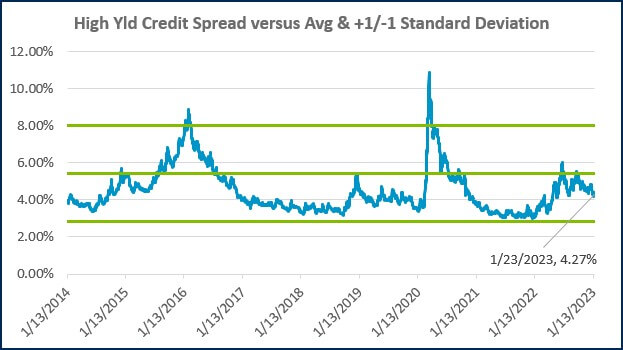
Source: FRED Database & ICE Benchmark Administration Limited (IBA)
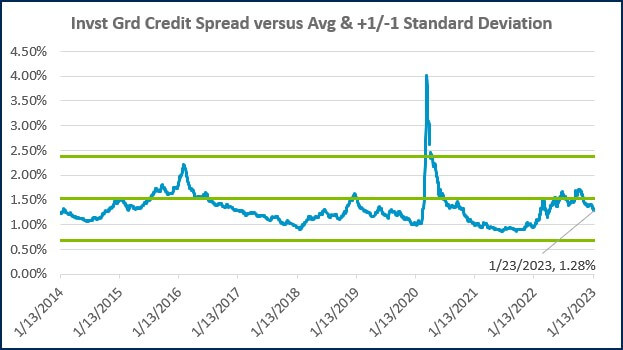
Source: FRED Database & ICE Benchmark Administration Limited (IBA)

- Competition, Achiever, Relator, Analytical, Ideation
Josh Jenkins, CFA
Josh Jenkins, Chief Investment Officer, began his career in 2010. With a background in investment analysis and portfolio management from his previous roles, he quickly advanced to his current leadership position. As a member of the Lutz Financial Board and Chair of the Investment Committee, he guides Lutz Financial’s investment strategy and helps to manage day-to-day operations.
Leading the investment team, Josh directs research initiatives, while overseeing asset allocation, fund selection, portfolio management, and trading. He authors the weekly Financial Market Update, providing clients with timely insights on market conditions and economic trends. Josh values the analytical nature of his work and the opportunity to collaborate with talented colleagues while continuously expanding his knowledge of the financial markets.
At Lutz, Josh exemplifies the firm’s commitment to maintaining discipline and helping clients navigate market uncertainties with confidence. While staying true to the systematic investment process, he works to keep clients' long-term financial goals at the center of his decision-making.
Josh lives in Omaha, NE. Outside the office, he likes to stay active, travel, and play golf.
Recent News & Insights

QuickBooks Online Checklist

What You Need to Know About the IRS’s CP53E Notices

Data-Driven Inventory Management: Using Power BI to Optimize Cash Flow & Financing

Duren & Martinson Named Forbes 2026 Best‑in‑State CPAs

