%20(1).jpg?width=264&height=160&name=Website%20Featured%20Content%20Images%20(2)%20(1).jpg)
%20(1).jpg?width=264&height=160&name=Website%20Featured%20Content%20Images%20(4)%20(1).jpg)
-Mar-08-2024-08-50-35-9527-PM.png?width=300&height=175&name=Untitled%20design%20(1)-Mar-08-2024-08-50-35-9527-PM.png)

%20(1)-1.jpg?width=264&height=160&name=Website%20Featured%20Content%20Images%20(2)%20(1)-1.jpg)
-1.jpg?width=264&height=160&name=Website%20Featured%20Content%20Images%20(1)-1.jpg)
%20(1).jpg?width=264&height=160&name=Website%20Featured%20Content%20Images%20(3)%20(1).jpg)


.jpg)


The so-called ‘60/40 portfolio’ has been a staple for investors for decades. It is an investment technique that balances the higher return potential of a 60% allocation to stocks with the relative stability of a 40% allocation to bonds. The approach is straightforward and effective. Despite its long-term track record, it can become a lightning rod for negative attention during periods when it comes under pressure. The criticism has not aged well historically.
While the 60/40 portfolio is the poster child for a balanced approach to investing, there is nothing special about that ratio. The appropriate mix between the two asset classes depends entirely on the unique circumstances of each investor. The 60/40 represents a moderate risk tolerance. Those who wish to be more aggressive can hold a higher proportion of stocks, while those who want to be more conservative can hold less.
2022 was characterized by widespread volatility. With stocks and bonds both posting losses for the year, there were few places for investors to hide. It’s relatively rare for stocks and bonds to struggle simultaneously for an extended period. This stems from the fact that the correlation between stock and bond returns is typically low and, at times, even negative. When one struggles, you often see the other do relatively well. For example, if the stock market were to fall because investors feared an economic slowdown may become a full-blown recession, you might see:
- Undisciplined investors fleeing some or all their stock holdings in favor of the relative safety of bonds.
- The Federal Reserve loosening monetary policy to stimulate economic activity.
Each of these developments would put downward pressure on interest rates, which would, in turn, cause existing bonds to appreciate. In this scenario, bonds would be resilient while stocks struggled. Alternatively, strong economic activity might lead to:
- Improved earnings results by businesses.
- Investors ditching bonds for the improved prospects and higher return potential of stocks.
- The Federal Reserve tightening monetary policy to keep the economy from overheating.
These developments would contribute to strong stock performance at a time when bonds lagged and/or potentially declined.
Last year was unusual in that the selloff in bonds likely caused the selloff in stocks. The highest pace of inflation in 40 years forced the Federal Reserve to aggressively tighten monetary policy. As a result, interest rates exploded higher and led to one of the worst years ever for bonds. Investors worried the speed and magnitude of rate increases would rapidly push the economy into a recession, thus leading to a substantial stock market decline. To put into context how rare last year was, since 1927, there have only been two other full years where both asset classes declined together (1931 & 1969).
Years With a Negative Return for Both Stocks & Bonds
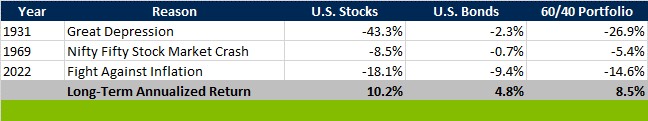
Source: Morningstar Direct from Jan 1927 through Nov 2023. U.S. Stocks are represented by the IA SBBI Large Cap Stock TR Index. U.S. Bonds are represented by the IA SBBI U.S. IT Government Bond Index. The 60/40 portfolio return assumes monthly rebalancing. Note that the stock index focuses primarily on large cap stocks, while the bond index is exclusively intermediate term Treasury Bonds. These indices aren’t the most representative of their respective asset classes. They were selected because they had the longest data history.
As mentioned previously, when stocks and bonds come under pressure simultaneously, even for a short period of time, people seem to come out of the woodwork to criticize the balanced investment approach. Ben Carlson recently published a nice blog highlighting this(1). He curated a list of headlines from major publications that pounced on the 60/40 portfolio at the first sign of trouble:
- June 29, 2017: The Way Wall Street Has Taught You to Invest for the Past 60 Years May Be Dead (CNBC)
- June 14, 2016: The 60/40 Portfolio is Dead and It’s Not Coming Back (Forbes)
- November 9, 2015: The 60/40 Stock-and-Bond Portfolio is Dead in 2016 (USA Today)
- November 16, 2014: Investment Managers Are Ditching 60/40 Portfolio in Favor of More Liquid Alternatives (Investment News)
- November 27, 2013: Investors Stock to the 60/40 Portfolio Rule are Likely to Get Badly Hurt (Business Insider)
- May 17, 2012: Why a Balanced Portfolio May Not Work (MarketWatch)
In my view, articles like those listed above are published for one of two reasons:
- It’s an attempt by news outlets to attract eyeballs by scaring people whose wealth is managed via a balanced approach (most of their readers).
- It’s an attempt by investment managers to peddle a more complicated (higher fee) strategy.
It’s important (comical?) to note that a 60/40 portfolio would have delivered a positive return in each year one of the above articles was published(2) (2012-2017). The average return over that 6-year period was 10.1%, essentially matching the long-term return of the U.S. stock market. Not bad for a portfolio with 40% of its holdings allocated to relatively ‘safe’ assets.
2023 is on pace for a much more pleasant year for investors. Through November, the 60/40 portfolio is up 12.7%, placing this year firmly in the top half of annual returns since 1927. The month of November was particularly strong. The 6.5% return in November 2023 would rank in the top 3% of the 1,163 months in the period.
Sadly, no investment strategy works all the time. Undisciplined investors would have been tempted to liquidate their stock and bond holdings for the perceived safety of cash in 2022. Those investors who have been able to tune out the noise and stick with their balanced portfolio have been rewarded this year.
- “A Short History of the 60/40 Portfolio”, A Wealth of Common Sense (blog) June 26, 2022, https://awealthofcommonsense.com/2023/11/a-short-history-of-the-60-40-portfolio/
- All references to performance of the 60/40 portfolio use the same indices and methodology used in the table: “Years with a Negative Return for both Stocks and Bonds”
Week in Review
- The latest update for the S&P CoreLogic Case-Schiller National Home Price Index, which measures home prices across the country, showed home prices rose to the highest level since 1987 (the inception of the index) in September and rose 3.9% year-over-year. Home prices in Detroit experienced the strongest annual price growth at 6.7%, while Las Vegas was the weakest over the past year, with prices falling 1.9% on an annual basis.
- The first revision to the third quarter GDP was released last Wednesday, November 29th, and showed growth revised up to a 5.2% annual rate from 4.9%. The revised numbers highlighted that household spending, which represents roughly 70% of the U.S. Economy, was up 3.6% in the third quarter. Business Investment and Government spending were also strong contributors to third-quarter GDP, rising 2.4% and 5.5%, respectively.
- The latest ISM (Institute for Supply Management) manufacturing PMI, a gauge for economic activity in the manufacturing sector, remained unchanged at 46.7 in November. This marked the 13th consecutive month that manufacturing PMI stayed below 50, an indication of contraction in manufacturing activity, and is the longest period the index has stayed under 50 since the period from August 2000 to January 2002. The ISM non-manufacturing PMI will be published this week.
Hot Reads
Markets
- Fed’s Interest Rate Hikes Are Probably Over, But Officials Are Reluctant To Say So (WSJ)
- Fed’s Favorite Guage Shows Inflation Rose 0.2% in October and 3.5% From a Year Ago, As Expected (CNBC)
- U.S. GDP Grew at a 5.2% Rate in the Third Quarter, Even Stronger Than First Indicated (CNBC)
Investing
- Charlie Munger’s Life Was About Way More Than Money (Jason Zweig)
- Munger Was Buffett’s Alter-Ego, Uniquely Able to Identify His Business Partner’s Blind Spots (MarketWatch)
- An Important Distinction About People That Spend Less Than They Earn (Morgan Housel)
Other
- Why CFB’s Identity Crisis Resulted in Florida State Being Cheated (The Athletic)
- Companies, Countries Battle to Develop Quantum Computers – 60 Minutes (YouTube)
- 5 Different Golf Ball Rollback Scenarios, Explained for Amateur Golfers (Golf Digest)
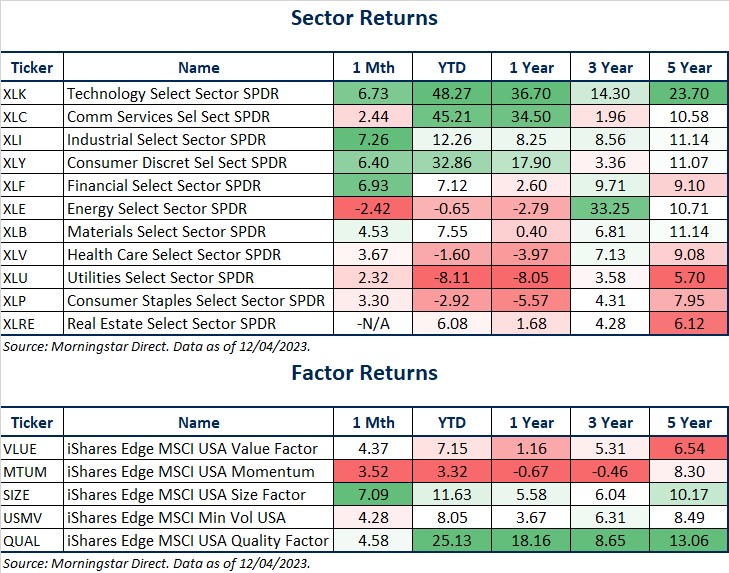
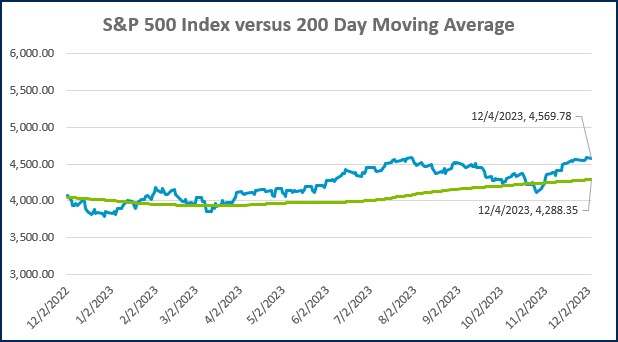
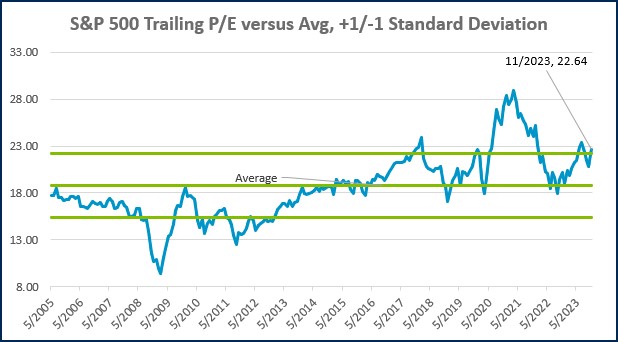
Markets at a Glance

Source: Morningstar Direct.
Source: Morningstar Direct.
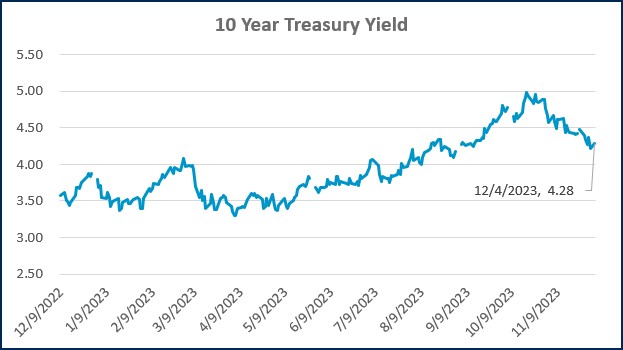
Source: Treasury.gov
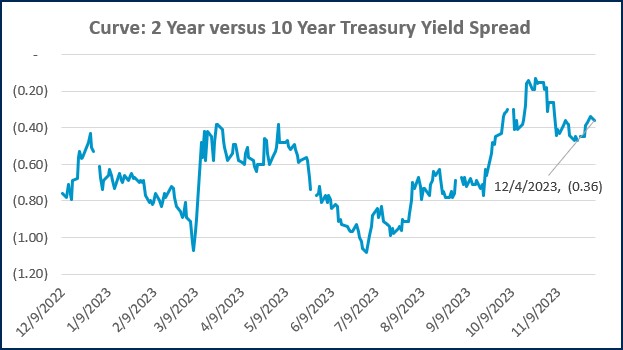
Source: Treasury.gov
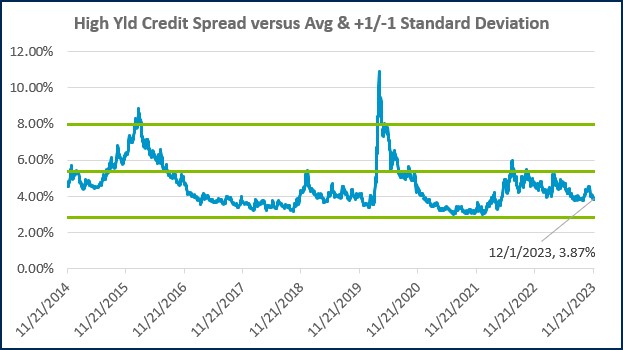
Source: FRED Database & ICE Benchmark Administration Limited (IBA)
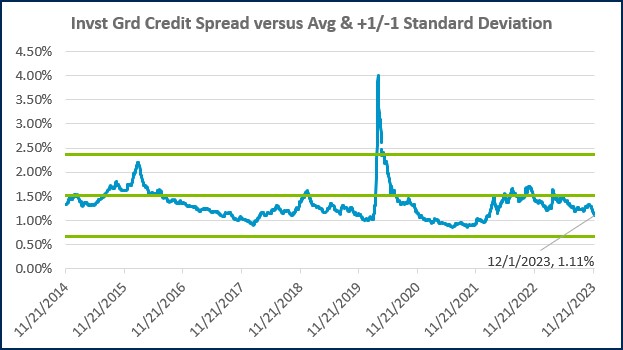
Source: FRED Database & ICE Benchmark Administration Limited (IBA)
Economic Calendar
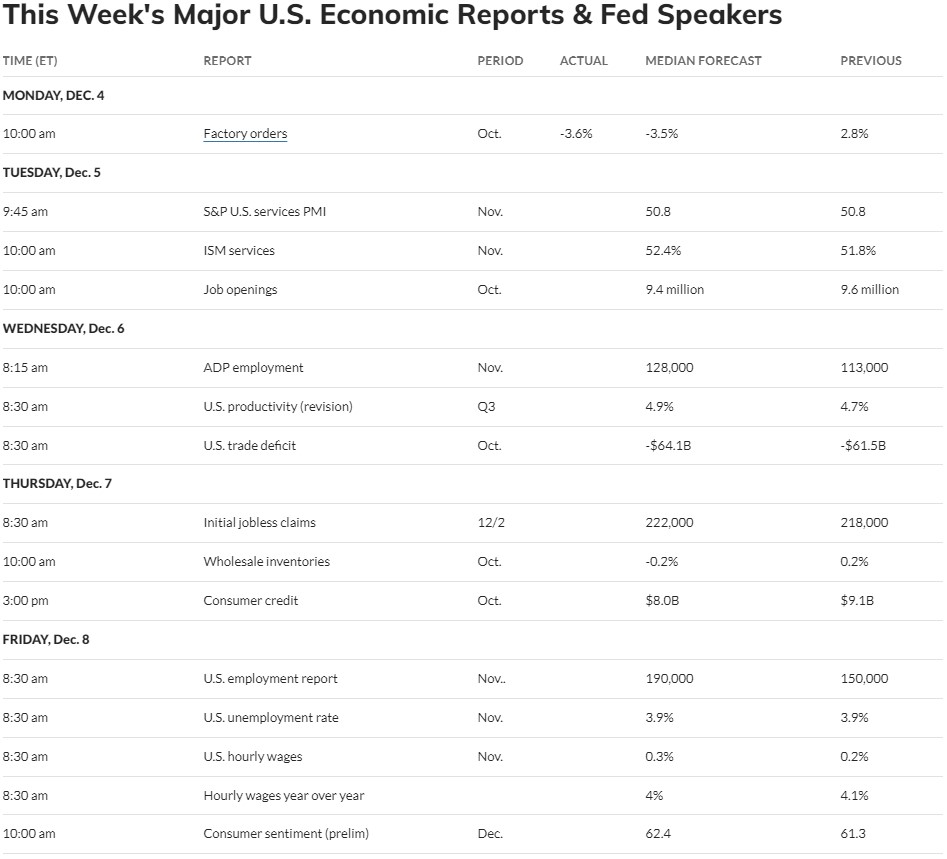
Source: MarketWatch

- Competition, Achiever, Relator, Analytical, Ideation
Josh Jenkins, CFA
Chief Investment Officer, Principal
Josh Jenkins, Chief Investment Officer, began his career in 2010. With a background in investment analysis and portfolio management from his previous roles, he quickly advanced to his current leadership position. As a member of the Lutz Financial Board and Chair of the Investment Committee, he guides Lutz Financial’s investment strategy and helps to manage day-to-day operations.
Leading the investment team, Josh directs research initiatives, while overseeing asset allocation, fund selection, portfolio management, and trading. He authors the weekly Financial Market Update, providing clients with timely insights on market conditions and economic trends. Josh values the analytical nature of his work and the opportunity to collaborate with talented colleagues while continuously expanding his knowledge of the financial markets.
At Lutz, Josh exemplifies the firm’s commitment to maintaining discipline and helping clients navigate market uncertainties with confidence. While staying true to the systematic investment process, he works to keep clients' long-term financial goals at the center of his decision-making.
Josh lives in Omaha, NE. Outside the office, he likes to stay active, travel, and play golf.
Recent News & Insights

Recent News
Lutz Announces 2026 Shareholder & Director Promotions
Lutz, a Nebraska-based business solutions firm, is proud to announce the promotion of 10 team ...

Nonprofit
Internal Controls for Nonprofit Organizations: Safeguarding Your Mission
Nonprofit organizations operate with a high level of accountability, ensuring every dollar ...

Job Seeker
Career Pivots: How to Identify What Matters Most
Most people don’t follow a perfectly straight career path. Outside of highly specialized ...

Accounting
Trump Accounts: What Families Need to Know
A new savings and investment program called Trump Accounts launched on July 4, 2026, creating ...


Let’s get you where you want to go.
We work to simplify complexities, help make critical business decisions, and confidently focus on the things that are truly important to you. We embrace your business as our own to spark the right solutions and help you thrive.