A Symbolic Recovery 34 Years in the Making + Market Update + 2.27.24

The Nikkei 225, a popular index representing the Japanese stock market, closed at an all-time high late last week. This may not sound like a newsworthy event, particularly since the S&P 500 has achieved the same feat on 118 occasions since 2020. Still, the new high for Japan represents a symbolic milestone. To understand why, you’ll have to rewind a few decades.
In the years following the devastation of World War II, Japan rapidly transformed from a depleted shell into a powerful engine of growth. Widely regarded as an economic miracle, its GDP from the mid-1950s to 1970 rose at the fastest rate in the world(1).
Japan emerged as an exporting powerhouse and a fierce economic rival to the United States. Decades of heavy investment in productive capacity, intense domestic competition that encouraged the rapid adoption of innovative manufacturing techniques, and a weak currency made Japanese goods extremely competitive on the global stage.
Japan’s economic miracle would ultimately transform into one of the most famous asset price bubbles in history. Between 1985 and 1990, Japan’s stock market and real estate prices exploded higher, rising more than 3-fold during the brief five-year period. Both asset classes easily surpassed their US counterparts and became the most valuable in the world.
The charts below illustrate the value of Japanese stocks and real estate between 1964 and 2010. Each reflects the classic bubble pattern of parabolic growth followed by a rapid collapse.
Japanese Stocks – Nikkei 225 (1964-2010)
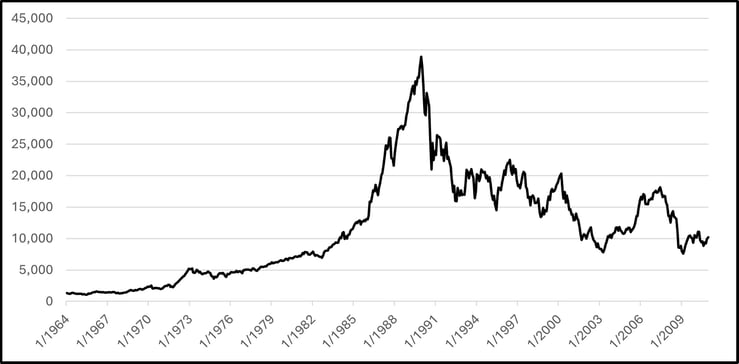
Source: Morningstar Direct. Chart reflects the Nikkei 225 PR JPY Index from Jan 1964 to Dec 2010.
Japanese Land Prices for 6 Major Cities (1964-2010)
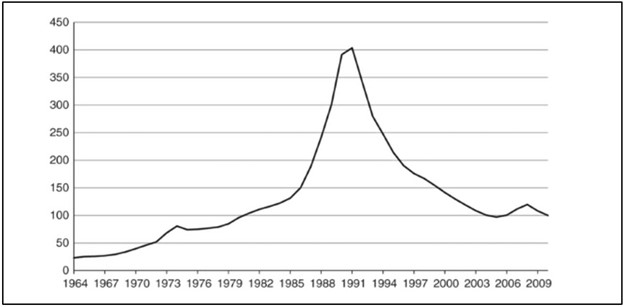
Source: Boom and Bust
How the economic miracle ended in financial calamity is still debated. A few contributing factors that are commonly cited include:
- The deregulation of financial markets that began in the 1970s.(1)
- A policy that tied the amount banks could lend with the value of the stock market and real estate. Lending pushed prices higher, which allowed more lending, which pushed prices higher in a self-reinforcing cycle. (1)
- The rise of ‘Zaitech’ (translated as financial engineering) encouraged corporations to prioritize speculating on financial assets like stocks and real estate over operating results. (2)
- Excessively loose monetary policy following the Plaza Accord and the subsequent appreciation of the Yen. (2)
Ultimately, the cause of the Japanese bubble can be summarized similarly to many other bubbles. Monetary policy was too accommodative for too long, underwriting standards were lax, speculation was rampant, and the prevailing view was that the good times would never end.
A few stunning examples of the bubble craziness(2):
- The total value of real estate in Japan in 1990 was estimated to be 4x the value of all real estate in the United States, despite being a fraction of the size.
- The grounds of the Imperial Palace in Tokyo alone were valued higher than all the real estate in California.
- Mortgages were being issued at 2x the value of the underlying property.
- The lifetime earnings of an average office worker in Tokyo were insufficient to buy even a small condo.
- Homebuyers were forced to take out generational 100-year mortgages.
- Department stores dedicated entire floors to give shoppers the ability to buy & sell stocks, commodities, and property.
- A bubble in golf club memberships developed, with over 20 clubs in Japan costing >$1 million to join. The total value of country club memberships was estimated to be $200 billion. Keep in mind this is in 1980s dollars. For context, the NFL generated a total Revenue in 2022 of just $12 billion, according to Forbes.
- The golf club membership bubble was so ridiculous that a secondary market was developed, and memberships were actively traded. Banks were even willing to provide loans with memberships used as collateral.
As we have already seen, this story ended poorly. The bubble was eventually popped by a tightening of monetary policy, as a series of five rate hikes beginning in May 1989 took the official rate from 2.5% to 6.0%. The Nikkei 225 declined by nearly -40% in 1990 alone. By the end of 2011, it remained a painful -78% below its peak! The economy has also suffered, experiencing multiple consecutive ‘Lost Decades’ of anemic growth and battling persistent deflation. Now, after 34 years, the Nikkei has finally established a new high thanks to strong corporate earnings and a shift toward returning more cash to shareholders.
Japanese Stocks – Nikkei 225 (1964-2024)
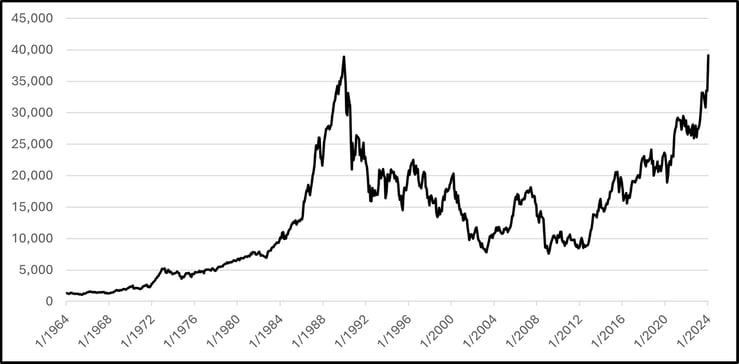
Source: Morningstar Direct. Chart reflects the Nikkei 225 PR JPY Index from 1/1/1964 to 2/22/2024.
Importantly, despite the recovery in prices, Japanese stocks don’t appear to be anywhere near bubble territory today. The current P/E ratio of 17.0 is a small fraction of the staggering 70.6 level from 1989(3). Additionally, Japanese stocks look attractive relative to their US counterparts. With the large-cap US stocks of the S&P 500 trading at a P/E of 24.2, Japan’s market is currently priced at a substantial 30% discount.
Note: The Price-to-Earnings (P/E) ratio is a popular valuation measure. It illustrates the price an investor must pay to participate in a dollar of earnings for an individual stock or an index of stocks. The lower the price paid, the more attractive the investment (all else equal).
- Tiberghien, Yves. “Navigating the Path of Least Resistance: Financial Deregulation and the Origins of the Japanese Crisis.” Journal of East Asian Studies, vol. 5, no. 3, 2005, pp. 427–64. JSTOR, http://www.jstor.org/stable/23417874. Accessed 27 Feb. 2024.
- Chancellor, Edward. Devil Take the Hindmost: A History of Financial Speculation. Farrar, Straus, Giroux, 1999.
- Landers, Peter. Japan’s Nikkei Stock Average Hits a Record, Propelled by Profits. WSJ, https://www.wsj.com/finance/stocks/japans-nikkei-after-34-years-briefly-tops-record-close-in-intraday-trading-7c29e029
Week in Review
- According to FactSet, 79% of the S&P 500 has reported Q4 results as of February 16th, 2024. The earnings growth rate, blended between companies that have already reported with the estimates for those that have yet to report, is at 3.2% year-over-year, which is above the analyst expectations of 1.6% going into this earnings season. Major companies to report this week include eBay, Salesforce, Paramount, and HP.
- The S&P CoreLogic Case-Schiller 20-city price index, which measures home prices in the largest 20 US Metropolitan areas, hit a record high in December 2023 and rose 6.1% year-over-year. This occurred in tandem with mortgage rates (as measured by the average 30-year fixed rate mortgage in the US) dropping below 7% in December, the first time they’ve been below 7% since early August of 2023.
- The latest CPI report released on February 13th showed consumer prices rising 3.1% in January from the prior year, the lowest reading since June 2023. While inflation continues to tick lower, one area where consumers aren’t getting relief is the cost of car ownership. The data revealed car insurance premiums rose a staggering 20.6% year-over-year in January, while the American Automobile Association (AAA) estimates that the total annual cost of car ownership climbed from $10,728 in 2022 to $12,182 in 2023. This increase reflects auto-loan borrowing costs and insurance premiums outpacing a decline in gas prices.
Hot Reads
Markets
- Fed Minutes Show Unease Over Premature Cuts (WSJ)
- Layoffs in 2024: A List of Companies Cutting Jobs This Year (WSJ)
- Price Rose More Than Expected in January as Inflation Won’t Go Away (CNBC)
Investing
- You Say Bitcoin is Digital Gold? Maybe It’s Digital Pearls (Jason Zweig)
- What If You Invested at the Peak Right Before the 2008 Crisis? (Ben Carlson)
- The Case For and Against Dividend ETFs (Nick Maggiulli)
Other
- Inside Look at U.S. Navy Response to Houthi Red Sea Attacks – 60 Minutes (YouTube)
- Gordon Ramsay Makes a Curry in a Hurry – Next Level Kitchen (YouTube)
- Moon Landing: US Clinches First Touchdown in 50 Years (Reuters)
Markets at a Glance
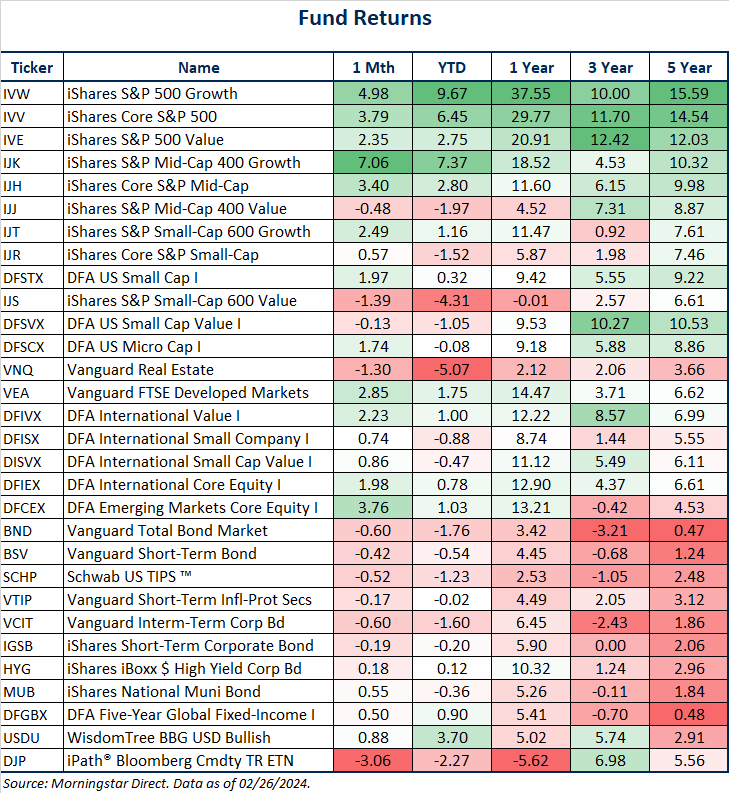
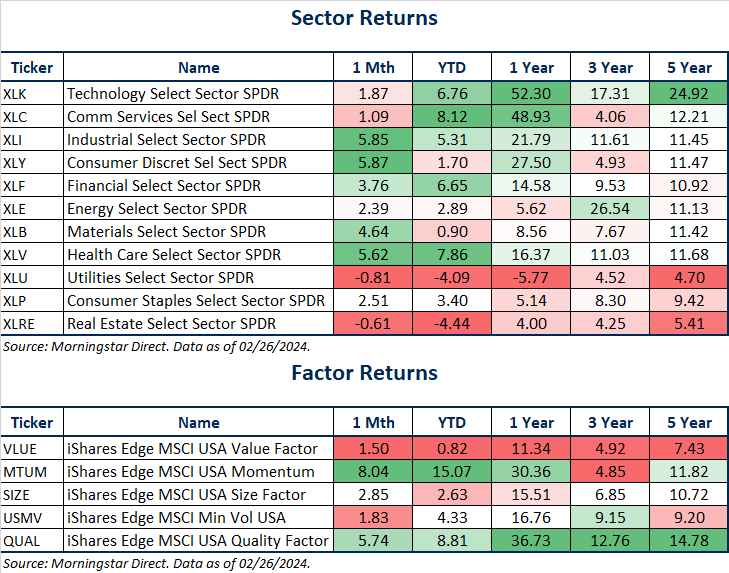
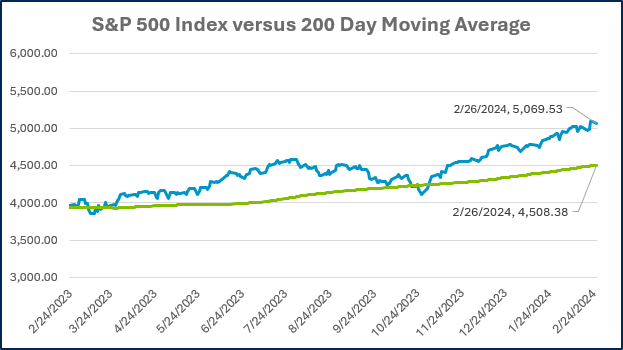
Source: Morningstar Direct.
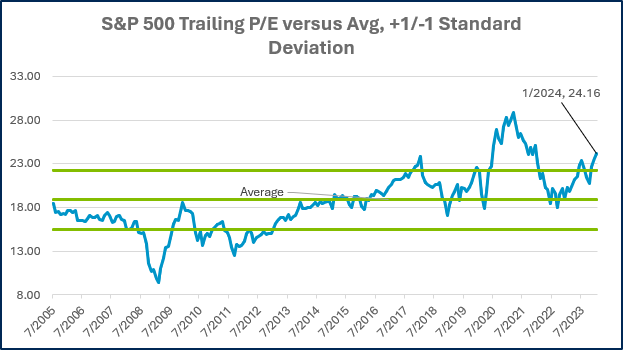
Source: Morningstar Direct.
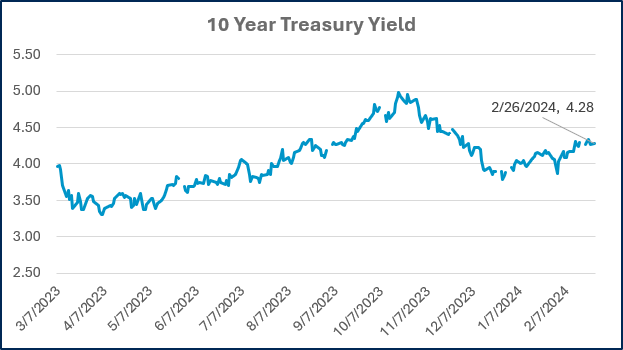
Source: Treasury.gov
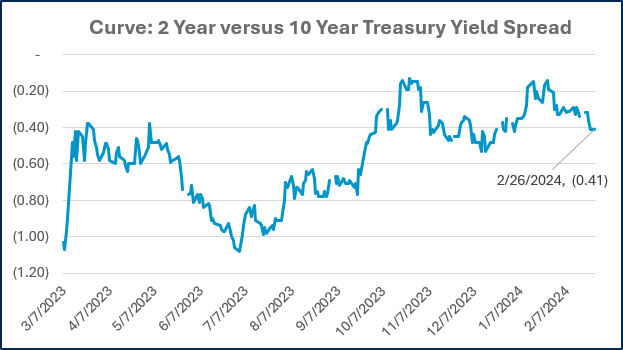
Source: Treasury.gov
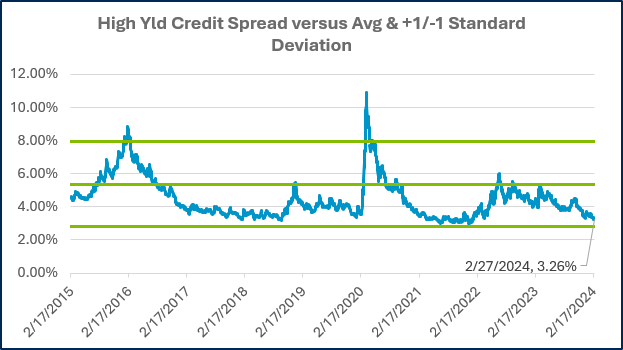
Source: FRED Database & ICE Benchmark Administration Limited (IBA)
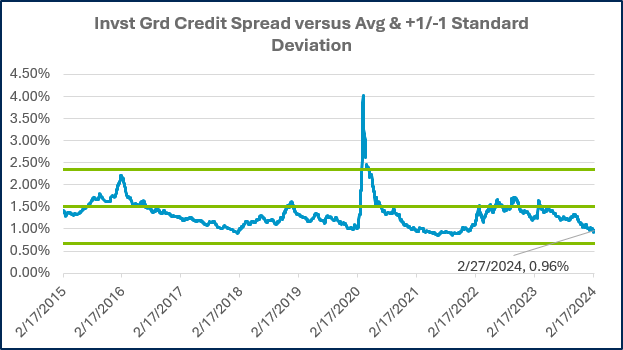
Source: FRED Database & ICE Benchmark Administration Limited (IBA)
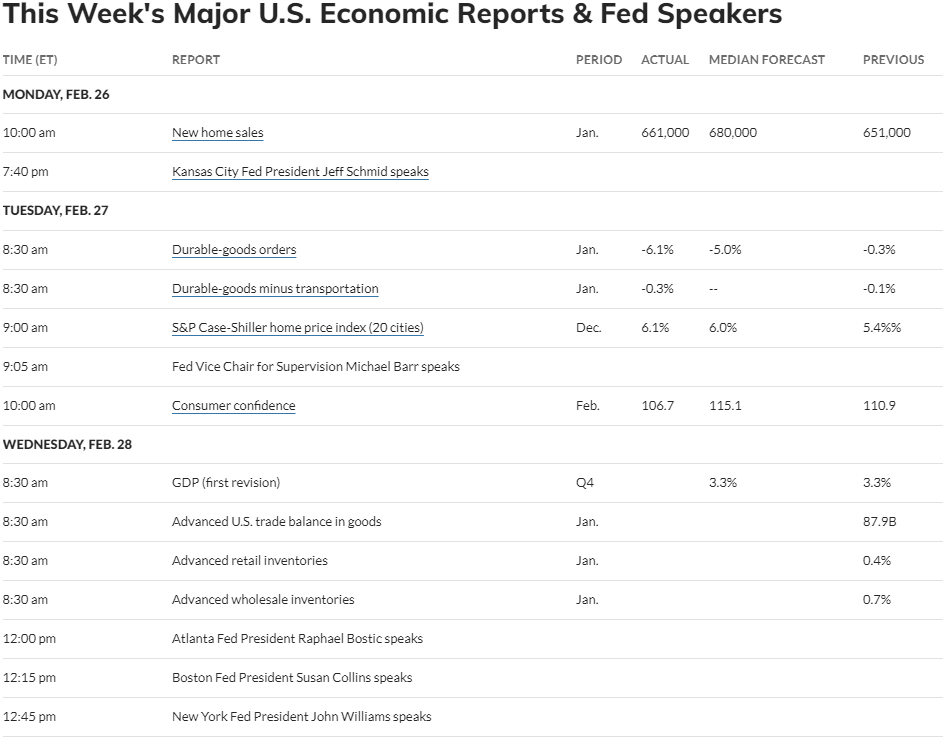
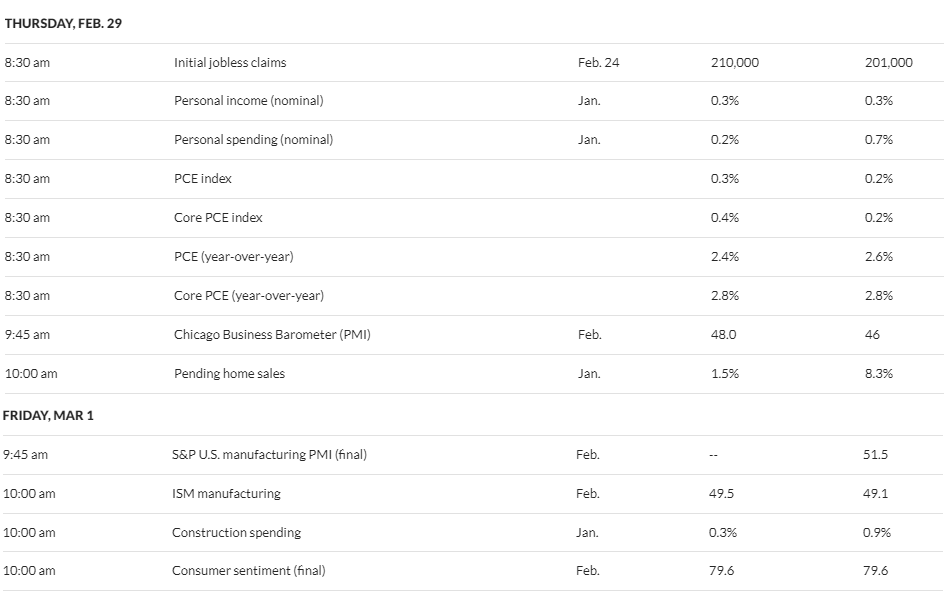
Economic Calendar
Source: MarketWatch

- Competition, Achiever, Relator, Analytical, Ideation
Josh Jenkins, CFA
Josh Jenkins, Chief Investment Officer, began his career in 2010. With a background in investment analysis and portfolio management from his previous roles, he quickly advanced to his current leadership position. As a member of the Lutz Financial Board and Chair of the Investment Committee, he guides Lutz Financial’s investment strategy and helps to manage day-to-day operations.
Leading the investment team, Josh directs research initiatives, while overseeing asset allocation, fund selection, portfolio management, and trading. He authors the weekly Financial Market Update, providing clients with timely insights on market conditions and economic trends. Josh values the analytical nature of his work and the opportunity to collaborate with talented colleagues while continuously expanding his knowledge of the financial markets.
At Lutz, Josh exemplifies the firm’s commitment to maintaining discipline and helping clients navigate market uncertainties with confidence. While staying true to the systematic investment process, he works to keep clients' long-term financial goals at the center of his decision-making.
Josh lives in Omaha, NE. Outside the office, he likes to stay active, travel, and play golf.
Recent News & Insights
Is sales-based apportionment helping or hurting your bottom line?
Employee Stock Ownership Plan (ESOP) Benefits & Best Practices
The 60/40 Portfolio is Alive and Well
International Momentum Continues


%20(1).jpg?width=300&height=175&name=Mega%20Menu%20Image%20(2)%20(1).jpg)
%20(1)-Mar-08-2024-09-27-14-7268-PM.jpg?width=300&height=175&name=Untitled%20design%20(6)%20(1)-Mar-08-2024-09-27-14-7268-PM.jpg)

%20(1)-Mar-08-2024-09-11-30-0067-PM.jpg?width=300&height=175&name=Untitled%20design%20(3)%20(1)-Mar-08-2024-09-11-30-0067-PM.jpg)
%20(1).jpg?width=300&height=175&name=Mega%20Menu%20Image%20(3)%20(1).jpg)
%20(1).jpg?width=300&height=175&name=Mega%20Menu%20Image%20(4)%20(1).jpg)
%20(1).jpg?width=300&height=175&name=Mega%20Menu%20Image%20(5)%20(1).jpg)
-Mar-08-2024-08-50-35-9527-PM.png?width=300&height=175&name=Untitled%20design%20(1)-Mar-08-2024-08-50-35-9527-PM.png)


.jpg)


