%20(1).jpg?width=264&height=160&name=Website%20Featured%20Content%20Images%20(2)%20(1).jpg)
%20(1).jpg?width=264&height=160&name=Website%20Featured%20Content%20Images%20(4)%20(1).jpg)
-Mar-08-2024-08-50-35-9527-PM.png?width=300&height=175&name=Untitled%20design%20(1)-Mar-08-2024-08-50-35-9527-PM.png)

%20(1)-1.jpg?width=264&height=160&name=Website%20Featured%20Content%20Images%20(2)%20(1)-1.jpg)
-1.jpg?width=264&height=160&name=Website%20Featured%20Content%20Images%20(1)-1.jpg)
%20(1).jpg?width=264&height=160&name=Website%20Featured%20Content%20Images%20(3)%20(1).jpg)


.jpg)


Over the last year, the U.S. stock market has been dominated by a handful of large companies. Commonly known as the Magnificent 7, the group includes the likes of Microsoft, Apple, NVIDIA, Amazon, Meta (Facebook), Alphabet (Google), and Tesla. Just how impactful were these stocks on the overall market’s return? Consider the Russell 3000 Index, which consists of the largest 3,000 publicly traded U.S. stocks and is widely considered to be the best proxy for the entire U.S. stock market. The Russell 3000 Index gained 26.0% in 2023. If you removed the contribution of the Magnificent 7, the index would have returned only 15.7%. To say this another way, just seven companies contributed 40% of the performance of the largest 3,000 stocks!
Most people are likely to interact with the products from most of the Mag-7 daily. Would you believe me if I told you that:
- I typed this Market Update using Microsoft Word.
- I used Google’s Chrome web browser to access a market research portal hosted by Amazon Web Services (AWS), which runs on data centers powered by NVIDIA chips.
- I did this while listening to my Apple AirPods wirelessly connected to my iPhone.
- I was interrupted several times by Facebook/Instagram notifications.
I could have also told you that I drove to work this morning in my Tesla Model 3, but then one of those things would certainly not have been true. Not that I have anything against Tesla’s products. I know several Tesla owners that are extremely happy with their vehicles.
I’m not here to argue against the Mag-7 from a business standpoint. These are generally very good businesses, and I am an avid customer of most of them. A good business, however, does not always make a good investment. The merit of an investment can only be evaluated in the context of the price paid to own it. The best asset on the planet can be a poor investment if the price paid is too high.
To evaluate the price being paid to own the Mag-7 stocks, consider the chart below. It illustrates the total value of these seven companies, which comprises about 16.9% of the value of the global stock market. As you can see, that is roughly equivalent to the total value of the markets in Japan, the U.K., France, Canada, and China. To say it another way, for the price of owning the Mag-7, you could own all the stocks in the 2nd through 6th most valuable stock markets in the world!
Weight Within the Global Stock Market

Source: Dimensional Fund Advisors. Based on end of month holdings of the MSCI All Country World Index.
Valuation ratios provide us with a more technical lens with which to view the price paid for these companies. The average P/E ratio, which measures the price paid per dollar of underlying earnings, was 45.5 for the Mag-7 at the end of January. That is 2.4x higher than the 24.2 P/E for the Large-cap stocks of the S&P 500 and 3.1x higher than the 14.6 P/E for the small-cap stocks of the S&P 600. That is a MASSIVE premium relative to the rest of the U.S. stock market, which in turn trades at a premium to international stocks.
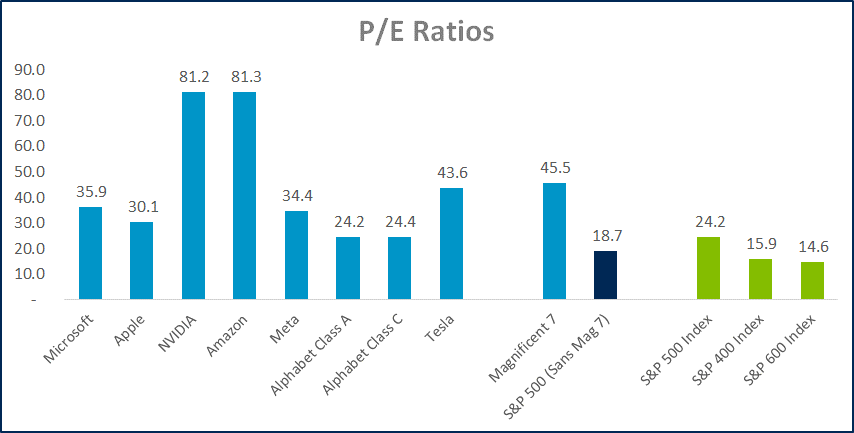
Source: Morningstar Direct. Data as of 1/31/2024. P/E ratios are based on the trailing 12 months. S&P weights based on the iShares S&P 500 ETF (IVV).
The Mag-7 represents some of the largest and most valuable companies in the world. Importantly, much of that value comes from the lofty expectations investors have placed on them. The reason investors are willing to pay these premiums is that the companies have dominated in the past, and investors are extrapolating that dominance into the future. This bet could prove to be risky for a variety of reasons:
- How do they maintain stratospheric growth when much of the world is already using their product daily?
- How do these companies defend their market share from each other as they increasingly compete in areas like cloud services, search, advertising, virtual reality, and artificial intelligence?
- How long can they defend market share from the next wave of nimble disrupters as they transition into bloated incumbents?
- Can these companies largely continue to avoid regulatory troubles?
- How do their stretched valuations fair in the next market downturn? The Mag-7 dramatically underperformed the market in 2022, falling -46% on average vs the Russell 3000’s decline of -19%.
A reasonable valuation offers investors some degree of a margin of safety when facing these risks. When valuations become stretched, as they are for the Mag-7, good results are not good enough. These stocks must operate flawlessly, or their valuation risks coming back to earth.
It’s not uncommon for the most valuable companies in the world to have a lofty valuation. With so many amazing businesses in the world, it would be extremely difficult to separate from the rest of the pack otherwise. It often takes a strong business and an even better story to get investors excited enough to pile in and bid the price all the way up to the top. This is likely the reason the performance of the largest stocks has historically been so poor.
The chart below illustrates how stocks performed in the ten years before and after becoming one of the ten largest. As you can see, in the years leading up to breaking into the top 10, returns significantly outpaced the rest of the market. While that superior relative performance continues for the first couple of years after breaking into the top 10, performance relative to the market eventually turns negative. History shows us that the largest and most dominant companies usually don’t remain a dominant investment.
Annualized Return in Excess of the U.S. Market Before and After Joining the Top 10 Largest US Stocks. January 1927 – December 2022
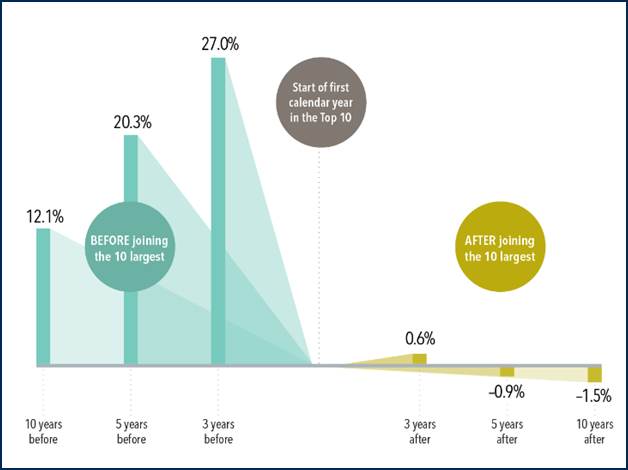
Source: Dimensional Fund Advisors. In USD. Data from CRSP and Compustat. Companies are sorted every January by beginning-of-month market capitalization to identify first-time entrants into the top 10. Market is defined as the Fama/French Total US Market Research Index.
Week in Review
- Federal Reserve officials voted to leave interest rates unchanged during their meeting last Wednesday, January 31st. This marks the fourth consecutive meeting of leaving interest rates unchanged, the longest period without an increase since the Fed began raising rates in March of 2022. When asked about the likelihood of rate cuts at their next meeting in March, Chairman Jay Powell responded that a rate reduction in March is unlikely. However, he suggested that the Fed remains on track to cut rates sometime in 2024.
- The latest ISM (Institute for Supply Management) manufacturing PMI, a gauge for economic activity in the manufacturing sector, rose from 47.1 in December to 49.1 in January, the highest level the index has reached since October 2023. This marked the 15th consecutive month that manufacturing PMI stayed below 50, an indication of contraction in manufacturing activity, and remains the longest period the index has stayed under 50 since the period from August 2000 to January 2002.
- According to FactSet, 46% of the S&P 500 has reported Q4 results as of last Friday (2/2). The earnings growth rate, blended between companies that have already reported with the estimates for those that have yet to report, is at 1.6% year-over-year, which is in line with analyst expectations going into this earnings season. Major companies to report this week include Chipotle, Ford, Disney, and PayPal, among others.
Hot Reads
Markets
- U.S. Economy Added 353,000 Jobs in January, Much Better Than Expected (CNBC)
- Powell Says Fed Has New Focus: When To Cut Rates (WSJ)
- U.S. Services Activity Expands More Than Expected, Says ISM (WSJ)
Investing
- A Few Thoughts On Spending Money (Morgan Housel)
- How Much Is That $70,000 Truck Costing You (Ben Carlson)
- Fed Chair Jerome Powell: The 2024 60 Minutes Interview (YouTube)
Other
- How to Train Your Cardiovascular Fitness – Peter Attia (YouTube)
- The New School Driving Strategy That Changed Golf – And Can Help Your Game (Golf Digest)
- Deliciously Simple Dinner Recipes – Gordon Ramsey (YouTube)
Markets at a Glance
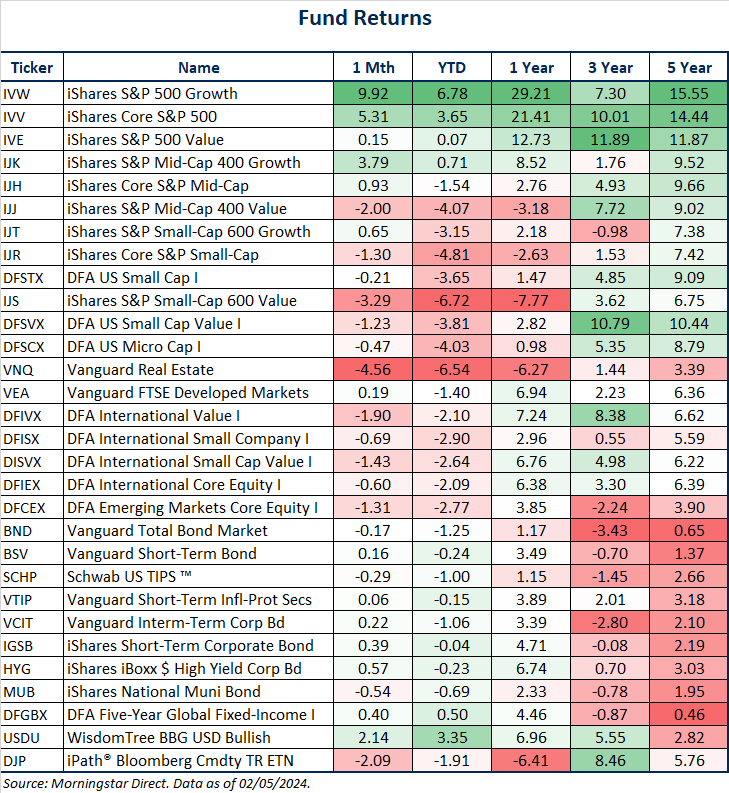
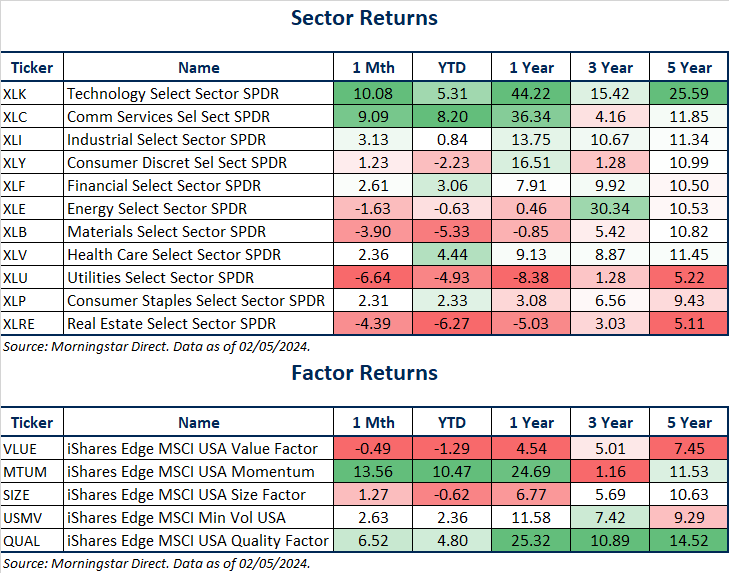
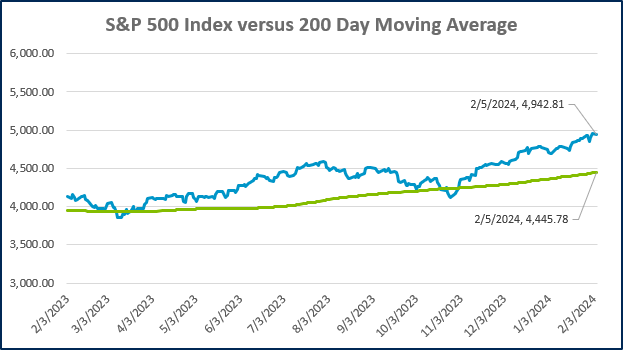
Source: Morningstar Direct.
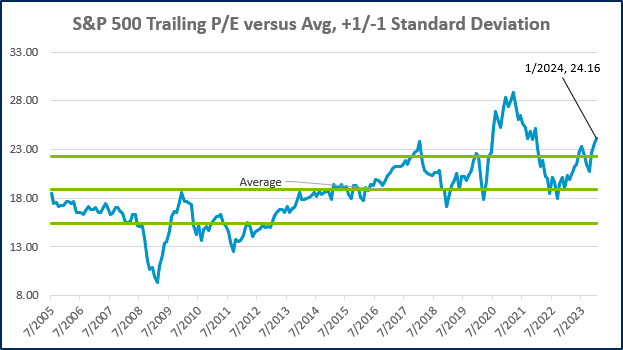
Source: Morningstar Direct.
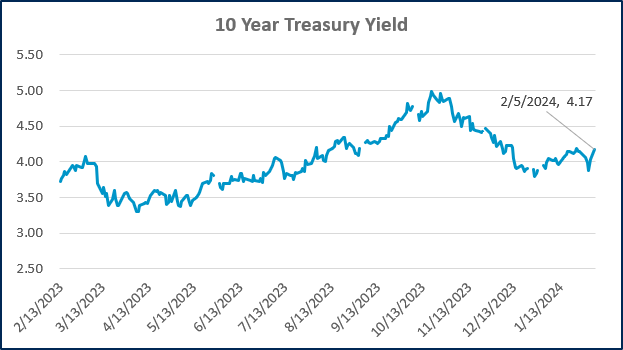
Source: Treasury.gov
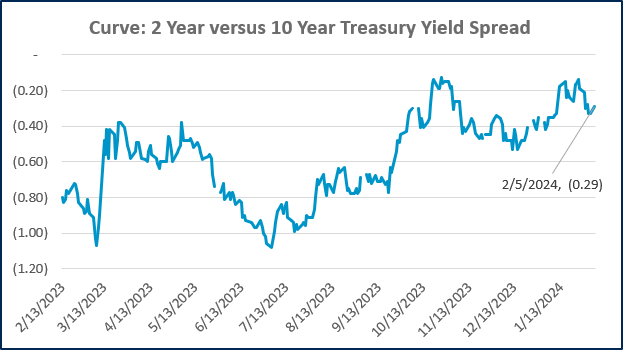
Source: Treasury.gov
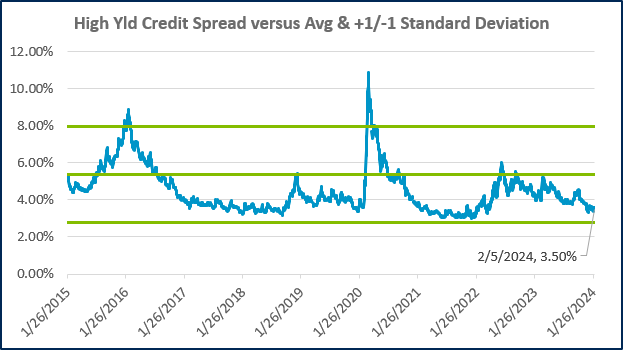
Source: FRED Database & ICE Benchmark Administration Limited (IBA)
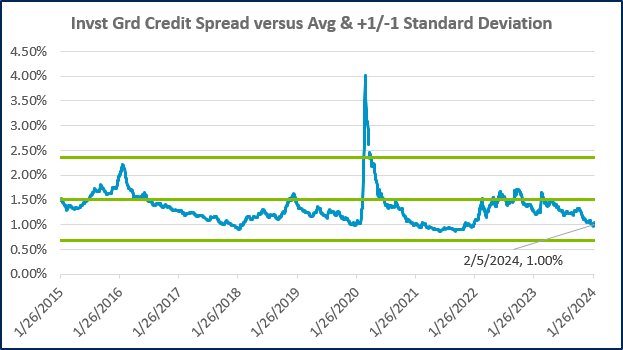
Source: FRED Database & ICE Benchmark Administration Limited (IBA)
Economic Calendar
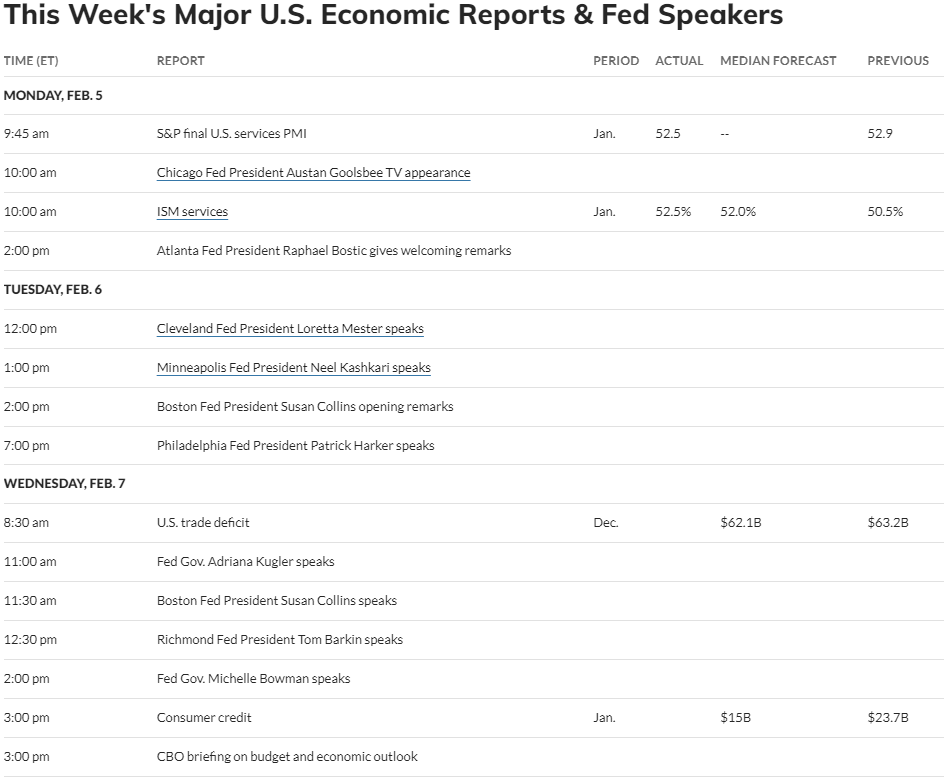
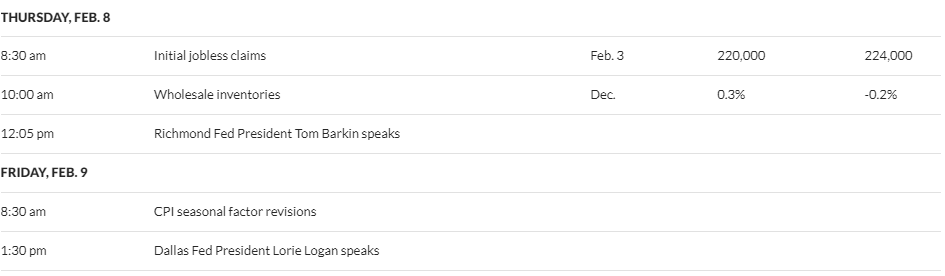
Source: MarketWatch

- Competition, Achiever, Relator, Analytical, Ideation
Josh Jenkins, CFA
Chief Investment Officer, Principal
Josh Jenkins, Chief Investment Officer, began his career in 2010. With a background in investment analysis and portfolio management from his previous roles, he quickly advanced to his current leadership position. As a member of the Lutz Financial Board and Chair of the Investment Committee, he guides Lutz Financial’s investment strategy and helps to manage day-to-day operations.
Leading the investment team, Josh directs research initiatives, while overseeing asset allocation, fund selection, portfolio management, and trading. He authors the weekly Financial Market Update, providing clients with timely insights on market conditions and economic trends. Josh values the analytical nature of his work and the opportunity to collaborate with talented colleagues while continuously expanding his knowledge of the financial markets.
At Lutz, Josh exemplifies the firm’s commitment to maintaining discipline and helping clients navigate market uncertainties with confidence. While staying true to the systematic investment process, he works to keep clients' long-term financial goals at the center of his decision-making.
Josh lives in Omaha, NE. Outside the office, he likes to stay active, travel, and play golf.
Recent News & Insights

Private Practice
Ransomware Readiness: 10 Questions Every Small Practice Should Ask
Ransomware is one of the most disruptive cyber threats facing healthcare organizations today. ...

Market Commentary
The Market & The Midterms
As November approaches, investors will hear increasingly confident predictions about what a ...

Recent News
Lutz Announces 2026 Senior through Manager Promotions
Lutz, a Nebraska-based business solutions firm, recently announced multiple promotions to ...

Recent News
Lutz Announces 2026 Shareholder & Director Promotions
Lutz, a Nebraska-based business solutions firm, is proud to announce the promotion of 10 team ...


Let’s get you where you want to go.
We work to simplify complexities, help make critical business decisions, and confidently focus on the things that are truly important to you. We embrace your business as our own to spark the right solutions and help you thrive.