A Milestone for Index Funds + 3.26.24

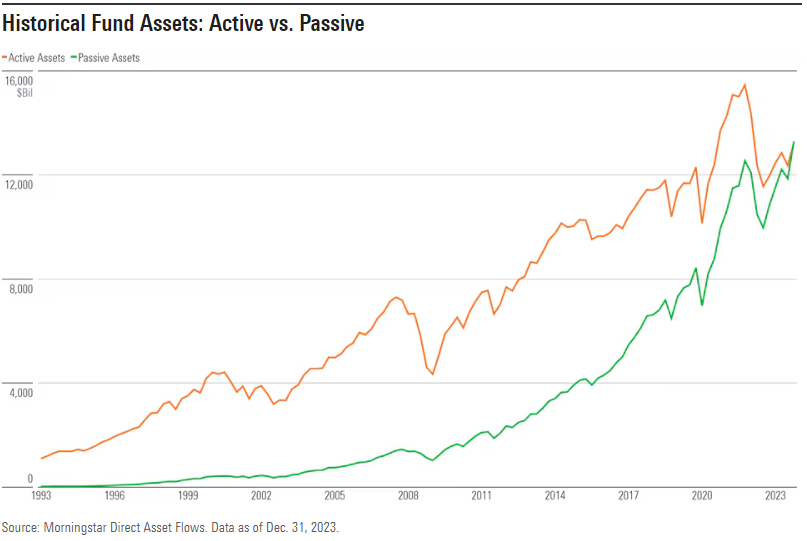
Passive index funds achieved a notable milestone at the end of 2023. For the first time ever, the total amount of assets managed within passive funds now exceeds those managed in their active counterparts. This development does not come as a surprise to market observers. For many years, assets have been flooding from active into passive, and for good reason. As we discussed in last week’s Market Update, the performance of actively managed funds has been horrendous.
The milestone is particularly impressive when you consider the relative youth of index funds. Actively managed funds were originally brought to market in the late 1800s with the advent of closed-end mutual funds. By the early 1920s, the first modern mutual fund was launched. It would be another fifty years before index funds would arrive on the scene.
The first index strategy was created in 1971 by Wells Fargo for the Samsonite Luggage Company’s pension fund. From there, the indexing approach slowly expanded among institutional investors. Within a couple of years, American National Bank and Batterymarch Financial Management created additional indexed portfolio offerings for use within the pensions of companies, including AT&T, Illinois Bell, Ford, and Exxon(1).
For an interesting bit of history, in 1995, Wells Fargo sold their pioneering indexed investment management business to the British investment bank Barclays. The newly acquired group was branded Barclays Global Investors (BGI). In 1996, BGI launched 17 ETFs that were among the first in the world. Initially known as World Equity Benchmark Shares (WEBS), these ETFs were rebranded in 2000 as iShares. In 2009, Barclays sold BGI (including the iShares brand) to Blackrock, making it the largest asset manager in the world.
It wasn’t until 1976 that John Bogle and Vanguard created the earliest index fund available to individual investors, The First Index Investment Trust. Now known as the Vanguard 500 Index Fund (VFINX), it has over $1 trillion in assets across its share classes and, on a standalone basis, is larger than all but a small handful of global asset managers. The fund was brought to market with the goal of raising $150 million. However, it fell well short of that objective, raising only $11 million. The initial launch of indexing for the masses was an outright failure and was labeled “Bogle’s Folly” by the financial media. Critics of the approach claimed it was “un-American” for investors to be willing to settle for “mediocrity.”
In reality, the results of passive investment strategies have been anything but mediocre. In fact, by achieving (roughly) the market average, investors in passive strategies have actually obtained above-average returns. This is the result of something Nobel Laureate Bill Sharpe famously dubbed "The Arithmetic of Active Management."
Over any specified time period, the market return will be a weighted average of the returns on the securities within the market. Each passive manager will obtain precisely the market return before costs. From this, it follows that the return on the average actively managed dollar must equal the market return. Why? Because the market return must equal a weighted average of the returns on the passive and active segments of the market. If the first two returns are the same, the third must be also.
Because active and passive returns are equal before cost and because active managers bear greater costs, the after-cost return from active management must be lower than that from passive management(2).
Meanwhile, the higher average underlying expense ratio of active vs passive funds creates a meaningful divide in fund performance. Expense ratios do not represent the entire story. There are a variety of other costs that disproportionately impact actively managed funds. These include:
- Higher trading activity, which leads to:
- More trading costs
- Larger tax consequences
- Cash drag
- Sales loads
Given the dismal track record for actively managed funds, it’s no surprise to see passive options dominating fund flows. The chart below illustrates the total assets managed in active vs. passive funds. While the rising tide of positive stock returns over time has lifted assets in both categories, you can see the relative growth of passive funds really accelerated following the financial crisis.
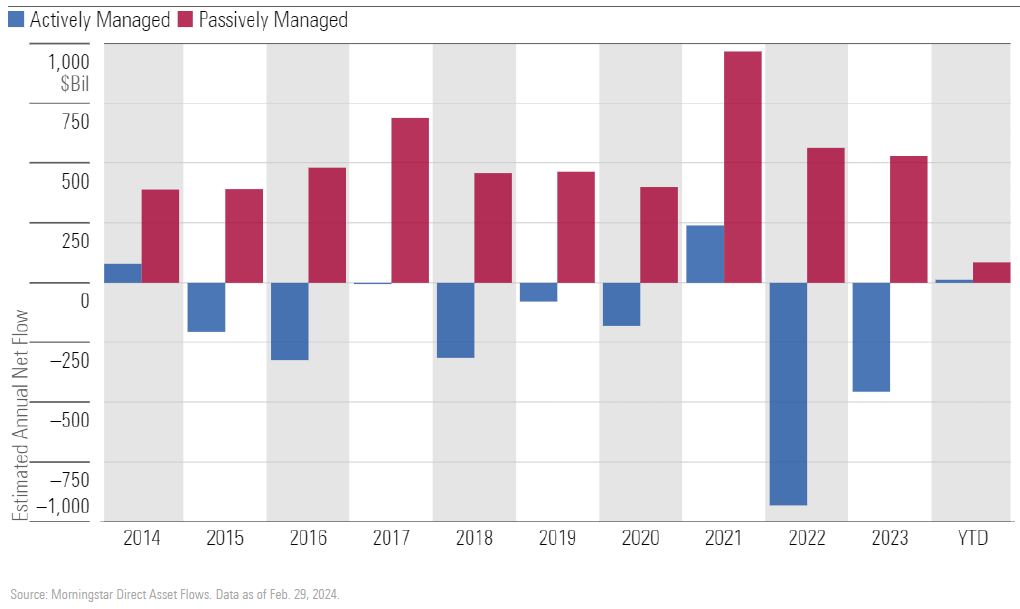
The chart below looks at actual fund flows in and out of each category. As the red bars indicate, index funds haven’t had a single year of outflows over the last decade. For active funds, inflows are the exception rather than the rule.
- O’Connell, Brenden. “A Pillar of Modern Finance Turns 50.” Enterprising Investor, CFA Institute. 01 July 2021, https://blogs.cfainstitute.org/investor/2021/07/01/a-pillar-of-modern-finance-turns-50/
- Sharpe, William F. “The Arithmetic of Active Management.” Financial Analysts Journal, vol. 47, no. 1, 1991, pp. 7–9. JSTOR, http://www.jstor.org/stable/4479386. Accessed 26 Mar. 2024.
Week in Review
- Federal Reserve officials voted unanimously to leave interest rates unchanged during their meeting last Wednesday, March 20th. They also released updated economic forecasts in its Summary of Economic Projections (SEP), which includes the dot plot that shows projections of the Federal Funds Rate by FOMC members. The projections released for next year showed that a narrow majority of FOMC members still project at least three rate cuts in 2024 (assuming .25% increments) despite inflation remaining stickier than anticipated the past few months. Market participants welcomed the news of the reaffirmed rate cut projections as the Dow Jones Industrial Average, S&P 500, and Nasdaq Composite all closed at record highs.
- The Cocoa Futures contract (per metric ton) for May eclipsed the $10,000 level for the first time ever today and has increased nearly 130% YTD. Cocoa’s price has been on a tear this year as disease and poor weather conditions have affected production in West Africa, accounting for roughly 70% of global cocoa production.
- The latest existing home sales data, released on March 21st, showed that home sales rose 9.5% in February from the prior month. This is the first time in more than two years that sales have increased for two consecutive months.
Hot Reads
Markets
- Fed Officials Still See Three Interest-Rate Cuts This Year, Buoying Stocks (WSJ)
- Former Fed Vice Chair Clarida Sees Possibility of Fewer Rate Cuts Than Expected This Year (CNBC)
- Falling Fertility Rates Pose Major Challenges For the Global Economy, Report Finds (CNBC)
Investing
- When Wall Street Rolls Out the Red Carpet To You, Who Pays? (Jason Zweig)
- Are Index Funds Propping Up the Stock Market (Ben Carlson)
- Smart Words From Smart People (Morgan Housel)
- Inside a Charles Barkley Range Session – Undercover Lessons – Golf Digest (YouTube)
- U.S. Fails to Ratify Ocean Mining Treat; Other Countries Rush Toward Underwater Riches – 60 Minutes (YouTube)
- A Structural Engineer Explains Why the Baltimore Bridge Collapsed (Scientific American)
Markets at a Glance
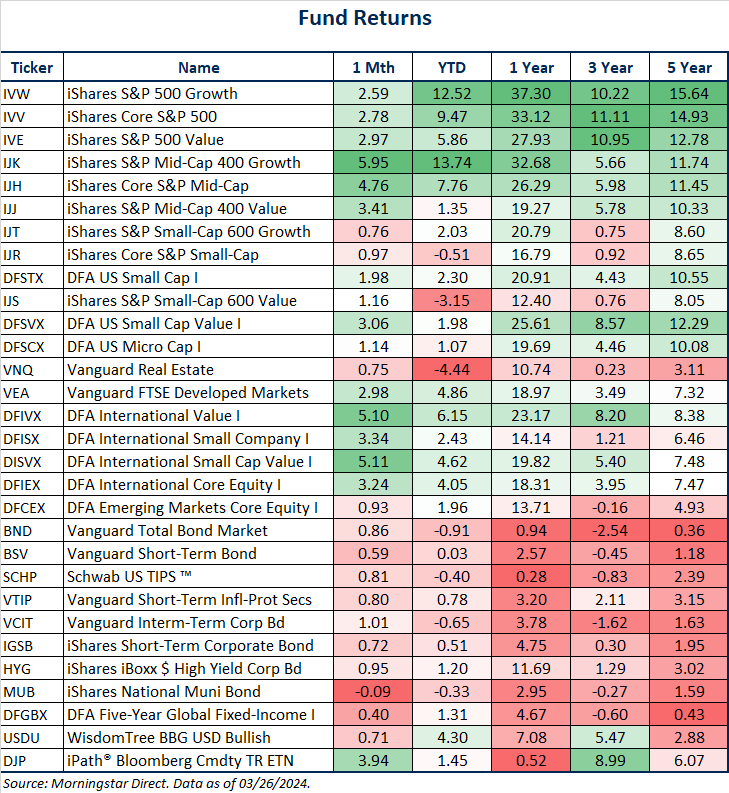
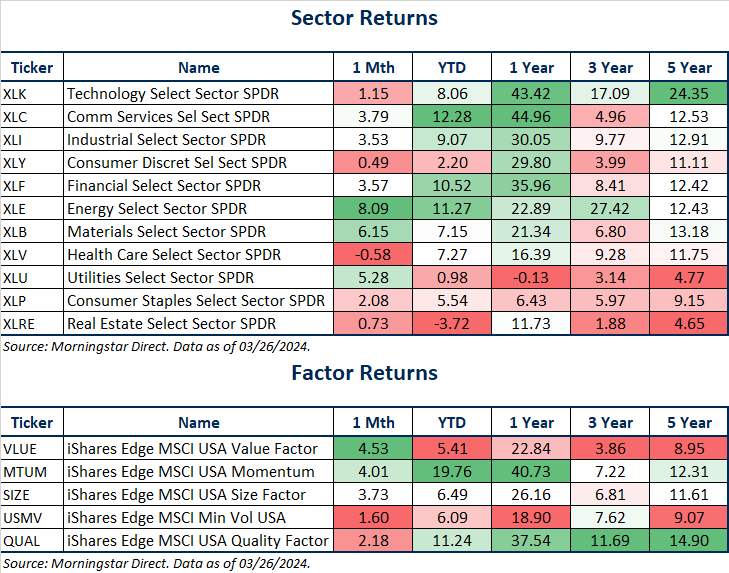
Source: Morningstar Direct.
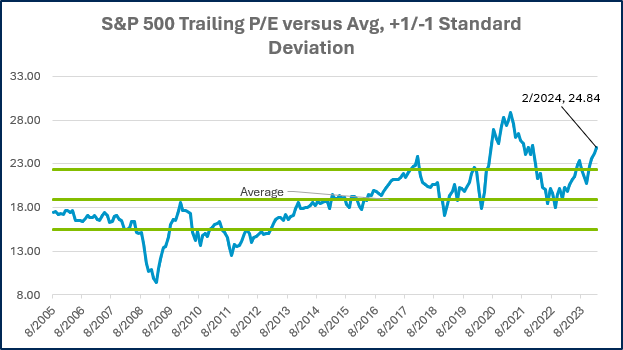
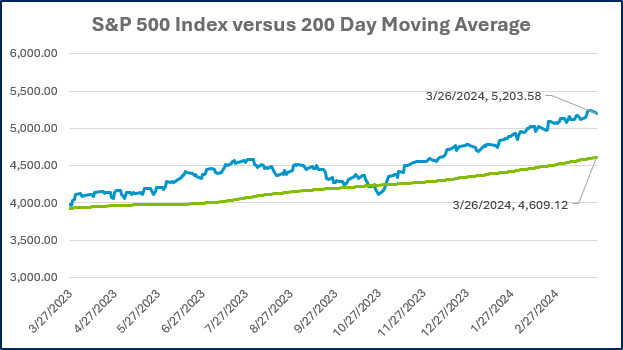
Source: Morningstar Direct.
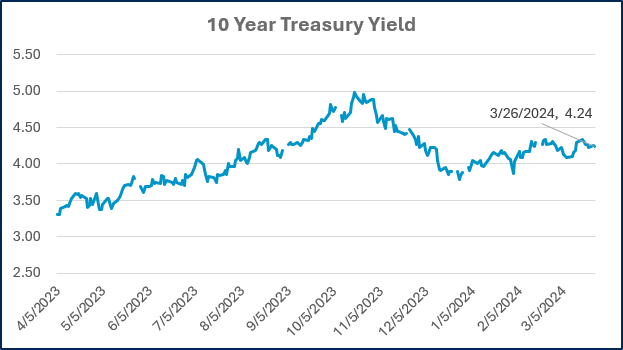
Source: Treasury.gov
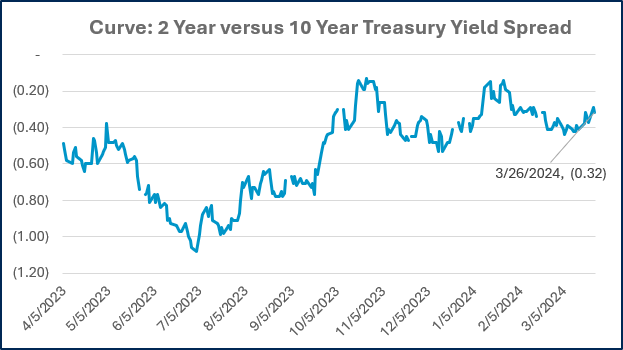
Source: Treasury.gov
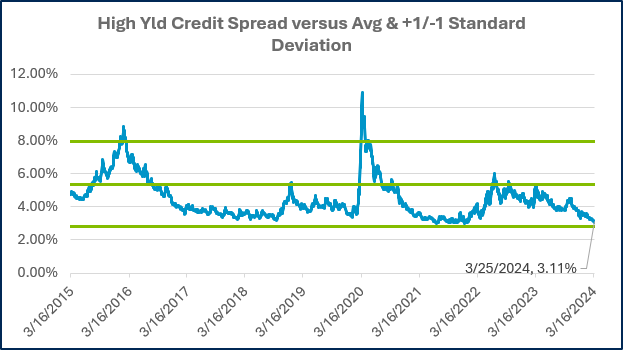
Source: FRED Database & ICE Benchmark Administration Limited (IBA)
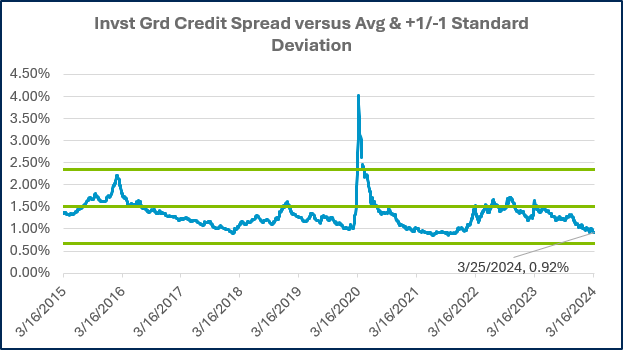
Source: FRED Database & ICE Benchmark Administration Limited (IBA)
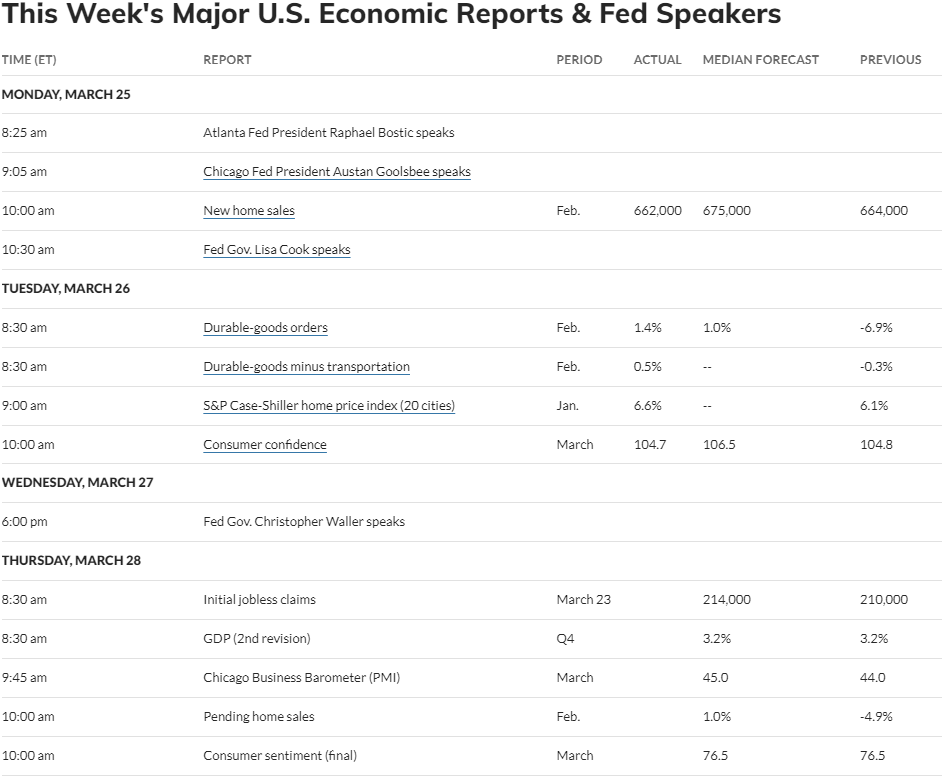
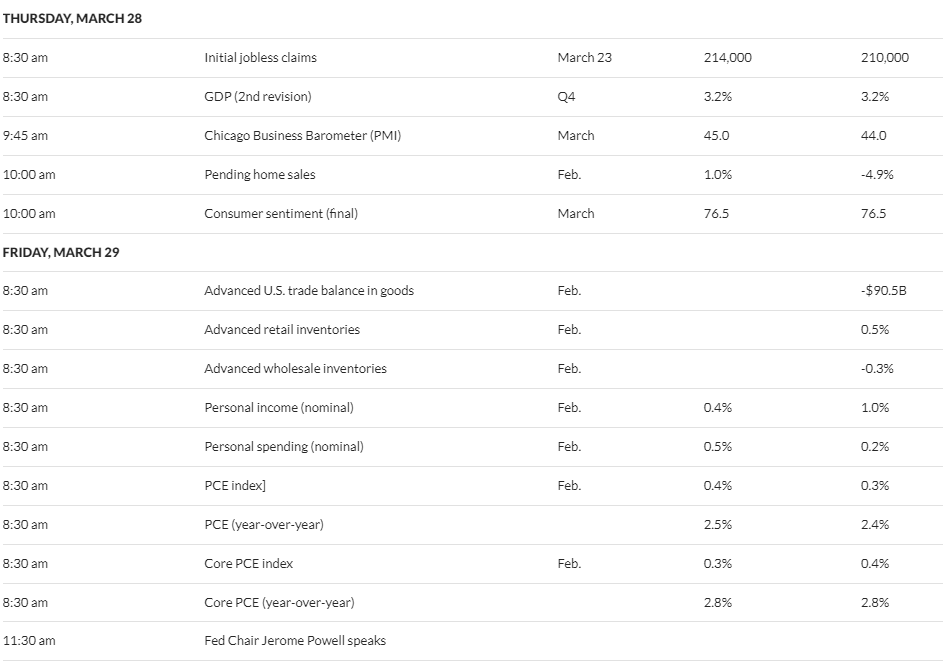
Economic Calendar
Source: MarketWatch

- Competition, Achiever, Relator, Analytical, Ideation
Josh Jenkins, CFA
Josh Jenkins, Chief Investment Officer, began his career in 2010. With a background in investment analysis and portfolio management from his previous roles, he quickly advanced to his current leadership position. As a member of the Lutz Financial Board and Chair of the Investment Committee, he guides Lutz Financial’s investment strategy and helps to manage day-to-day operations.
Leading the investment team, Josh directs research initiatives, while overseeing asset allocation, fund selection, portfolio management, and trading. He authors the weekly Financial Market Update, providing clients with timely insights on market conditions and economic trends. Josh values the analytical nature of his work and the opportunity to collaborate with talented colleagues while continuously expanding his knowledge of the financial markets.
At Lutz, Josh exemplifies the firm’s commitment to maintaining discipline and helping clients navigate market uncertainties with confidence. While staying true to the systematic investment process, he works to keep clients' long-term financial goals at the center of his decision-making.
Josh lives in Omaha, NE. Outside the office, he likes to stay active, travel, and play golf.
Recent News & Insights
Is sales-based apportionment helping or hurting your bottom line?
Employee Stock Ownership Plan (ESOP) Benefits & Best Practices
The 60/40 Portfolio is Alive and Well
International Momentum Continues


%20(1).jpg?width=300&height=175&name=Mega%20Menu%20Image%20(2)%20(1).jpg)
%20(1)-Mar-08-2024-09-27-14-7268-PM.jpg?width=300&height=175&name=Untitled%20design%20(6)%20(1)-Mar-08-2024-09-27-14-7268-PM.jpg)

%20(1)-Mar-08-2024-09-11-30-0067-PM.jpg?width=300&height=175&name=Untitled%20design%20(3)%20(1)-Mar-08-2024-09-11-30-0067-PM.jpg)
%20(1).jpg?width=300&height=175&name=Mega%20Menu%20Image%20(3)%20(1).jpg)
%20(1).jpg?width=300&height=175&name=Mega%20Menu%20Image%20(4)%20(1).jpg)
%20(1).jpg?width=300&height=175&name=Mega%20Menu%20Image%20(5)%20(1).jpg)
-Mar-08-2024-08-50-35-9527-PM.png?width=300&height=175&name=Untitled%20design%20(1)-Mar-08-2024-08-50-35-9527-PM.png)


.jpg)


