%20(1).jpg?width=264&height=160&name=Website%20Featured%20Content%20Images%20(2)%20(1).jpg)
%20(1).jpg?width=264&height=160&name=Website%20Featured%20Content%20Images%20(4)%20(1).jpg)
-Mar-08-2024-08-50-35-9527-PM.png?width=300&height=175&name=Untitled%20design%20(1)-Mar-08-2024-08-50-35-9527-PM.png)

%20(1)-1.jpg?width=264&height=160&name=Website%20Featured%20Content%20Images%20(2)%20(1)-1.jpg)
-1.jpg?width=264&height=160&name=Website%20Featured%20Content%20Images%20(1)-1.jpg)
%20(1).jpg?width=264&height=160&name=Website%20Featured%20Content%20Images%20(3)%20(1).jpg)


.jpg)


U.S. stocks have been on a tear for eighteen months. After reaching a bear market bottom in October 2022, the Russell 3000, a popular proxy for the entire U.S. market, has surged roughly 44% as of this week’s opening. Throughout this rally, ‘large-growth’ stocks have consistently led the charge. After such an extended period of outperformance, it’s tempting to believe the trend is destined to persist. This begs the question, how common is it for large growth to lead the way?
The chart below from Dimensional Fund Advisors (DFA) provides some historical perspective. It illustrates three different stock characteristics and how they have performed over various time periods going back as far as the 1920s. These characteristics include:
- Size: Small vs large
- Style: Value vs growth
- Profitability: High vs low
How Often Do Small Cap, Value, and High Profitability Outperform?
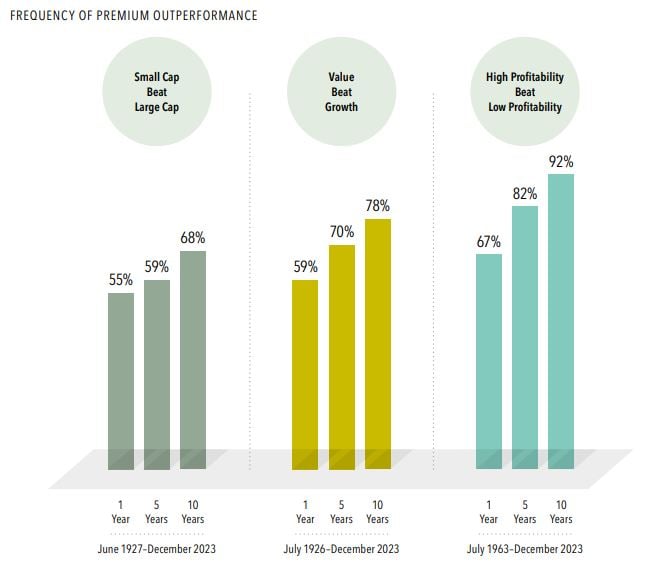
Source: Dimensional Fund Advisors (DFA). In USD. Chart based on monthly rolling returns, computed as follows: Dimensional US Small Cap Index minus S&P 500 Index, June 1927–December 2023; Fama/French US Value Research Index minus Fama/French US Growth Research Index, July 1926–December 2023; and Fama/French US High Profitability Index minus Fama/French US Low Profitability Index, July 1963–December 2023.
There are a couple of key points to take away from this chart.
- Over any one-year period, stocks with the small size, value style, and high profitability characteristics have historically had a small to moderate edge, outperforming 55% to 67% of the time.
- As you increase the measurement period from one to five years, the historical frequency of outperformance increases to 59-82%.
- After increasing the measurement period to ten years, the historical frequency of outperformance increases to 68-92%.
The data tells us that while it is not necessarily unusual to see large growth outperform over a short period of time, the odds do not favor it. Valuation, which is one of the most reliable predictors of future returns, provides an additional headwind for large growth. This can be demonstrated using a popular valuation metric like the price-to-earnings ratio (P/E), which signifies the price an investor must pay to participate in a dollar of earnings generated by a stock or market index.
The table below compares the current P/E ratio for large-growth stocks vs small-value stocks. For much of the last 23 years, these two cohorts have had comparable valuations. The beginning of the period coincides with the culmination of the Technology Bubble, where the prices of larger, growth-tilted stocks became massively inflated before ultimately bursting. In recent years, the valuation between the two has once again decoupled.
The current P/E ratio for the large-growth stocks of the S&P 500 Growth Index is 33.8, a level that would have been considered frothy even when interest rates were much lower than they are today. Given the average P/E for the S&P 500 Growth Index of 22.6, investors who wish to concentrate their portfolios in these stocks must pay a 50% premium compared to what they would have paid historically. The small-value stocks of the S&P 600 Value Index, on the other hand, currently trade at a P/E of 14.8. This represents a 12% discount to where these companies would typically trade.
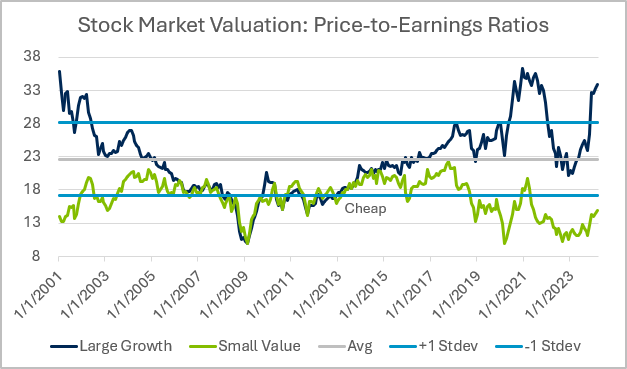
Source: Morningstar Direct. Data from Jan 2001 – March 2024. Large-growth stocks were represented by the S&P 500 Growth Index, small- value stocks were represented by the S&P 600 Value Index. The average and +/- 1 Stdev lines relate to the S&P 500 Growth Index only.
The fact that large growth has enjoyed a period of strong relative performance is not unusual. History shows us, however, that tilting a portfolio toward smaller, lower-priced, and profitable companies can be a way to put the odds in your favor and increase expected returns, particularly for investors who can remain disciplined and maintain those tilts over time. Current valuation also strongly favors a tilt toward small and value.
Week in Review
- Last week, the Bureau of Labor Statistics (BLS) provided an update on the Fed’s progress against inflation when it published the March Consumer Price Index (CPI). The data was once again higher than economists were expecting, rising 0.4% from February and 3.5% from the prior year. Core CPI, which excludes the volatile food and energy categories, also rose 0.4% month-over-month and 3.8% year-over-year.
- The market has reduced the amount of interest rate cuts it’s projecting for 2024 as inflation has remained stickier than expected. Fed funds futures are pricing in two quarter-point cuts versus the expectation of six to seven quarter-point rate cuts when the year began.
- With earnings season upon us, analysts at FactSet released their S&P 500 earnings growth estimate of 3.4% year-over-year for the first quarter. If the estimate comes to fruition, it will mark the third straight quarter that the S&P 500 has reported year-over-year earnings growth.
Hot Reads
Markets
- Consumer Prices Rose 3.5% From a Year Ago in March, More Than Expected (CNBC)
- Retail Sales Jumped 0.7% in March, Much Higher Than Expected (CNBC)
- Surging Inflation Fears Sent Markets Tumbling and Fed Officials Scrambling (CNBC)
Investing
- How Long Does it Take For a 10 Bagger in the Stock Market? (Ben Carlson)
- Lucky vs. Repeatable (Morgan Housel)
- A Smart Twist on One of the Stock Market’s Dumbest Ideas (Jason Zweig)
- How the Berlin Wall Worked - Neo (YouTube)
- How to Hit a Golf Ball Farther, According to Research (WSJ)
- Masters 2024: Scottie Scheffler Did What Was Expected, Which You’re Not Supposed to Do (Golf Digest)
Markets at a Glance
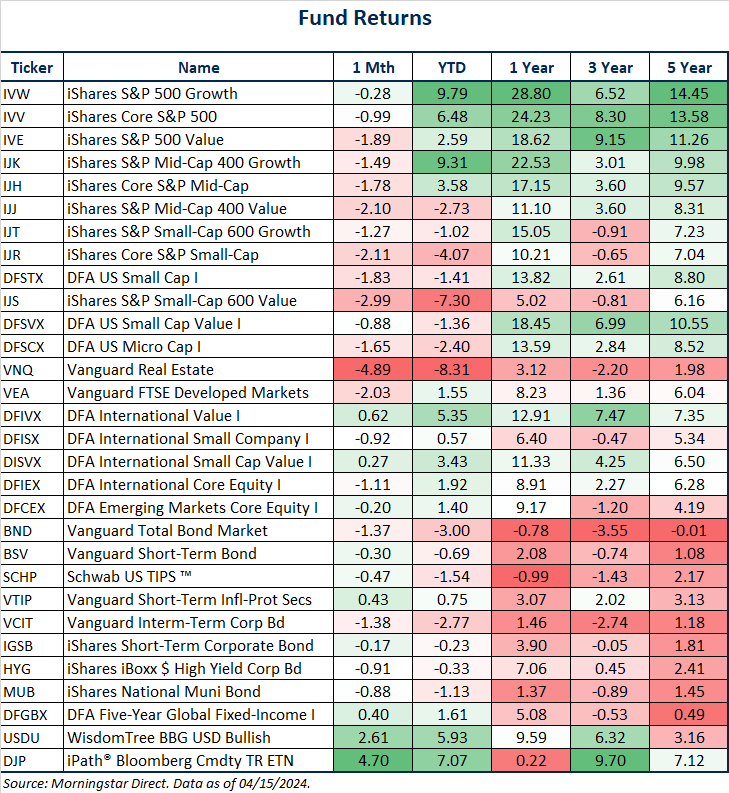
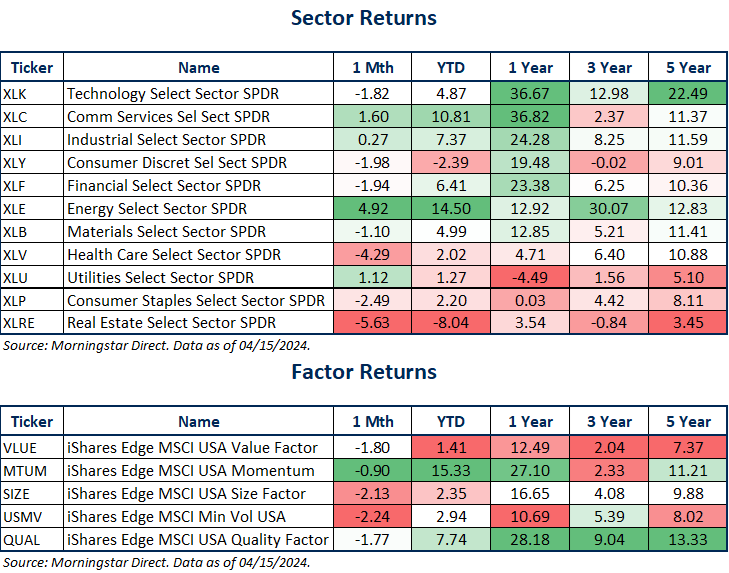
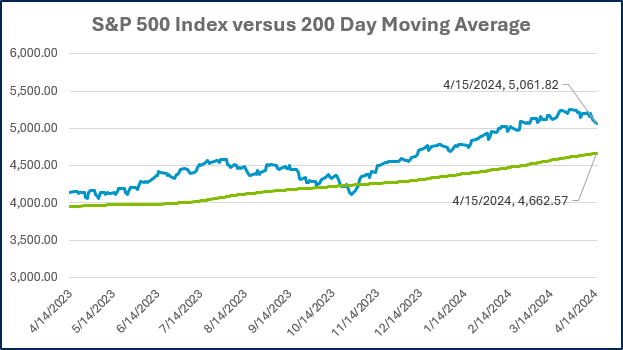
Source: Morningstar Direct.
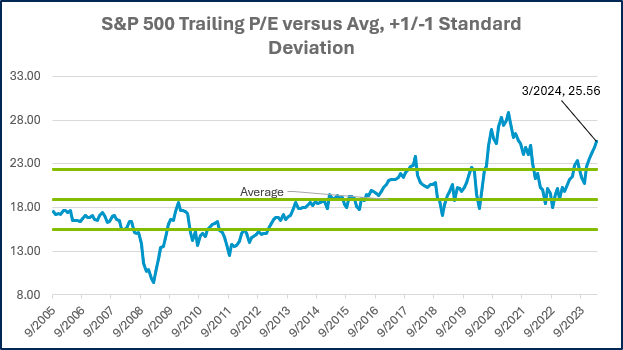
Source: Morningstar Direct.
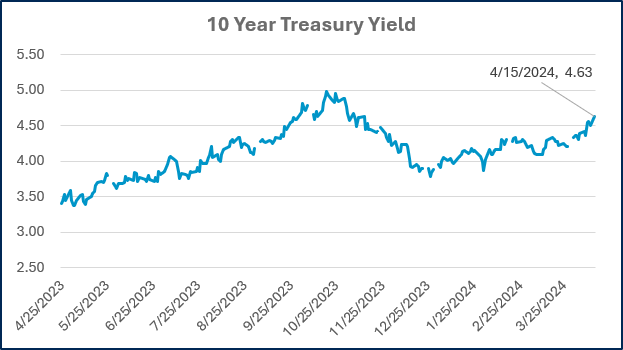
Source: Treasury.gov
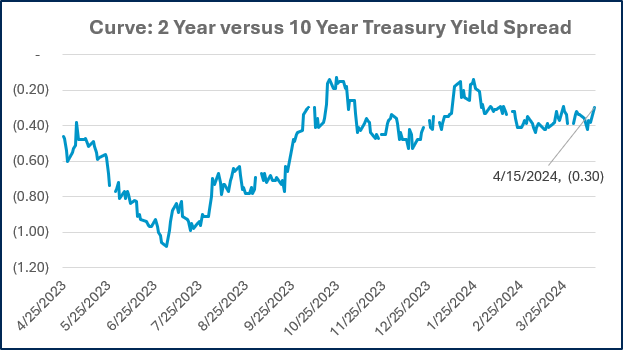
Source: Treasury.gov
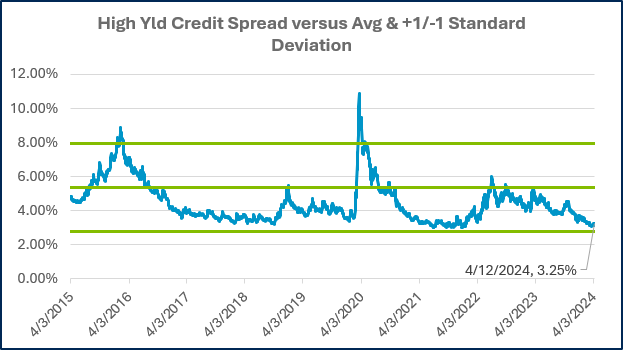
Source: FRED Database & ICE Benchmark Administration Limited (IBA)
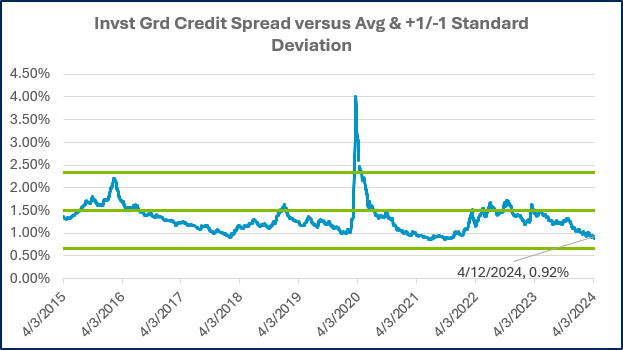
Source: FRED Database & ICE Benchmark Administration Limited (IBA)
Economic Calendar


Source: MarketWatch

- Competition, Achiever, Relator, Analytical, Ideation
Josh Jenkins, CFA
Chief Investment Officer, Principal
Josh Jenkins, Chief Investment Officer, began his career in 2010. With a background in investment analysis and portfolio management from his previous roles, he quickly advanced to his current leadership position. As a member of the Lutz Financial Board and Chair of the Investment Committee, he guides Lutz Financial’s investment strategy and helps to manage day-to-day operations.
Leading the investment team, Josh directs research initiatives, while overseeing asset allocation, fund selection, portfolio management, and trading. He authors the weekly Financial Market Update, providing clients with timely insights on market conditions and economic trends. Josh values the analytical nature of his work and the opportunity to collaborate with talented colleagues while continuously expanding his knowledge of the financial markets.
At Lutz, Josh exemplifies the firm’s commitment to maintaining discipline and helping clients navigate market uncertainties with confidence. While staying true to the systematic investment process, he works to keep clients' long-term financial goals at the center of his decision-making.
Josh lives in Omaha, NE. Outside the office, he likes to stay active, travel, and play golf.
Recent News & Insights

Recent News
Lutz Announces 2026 Shareholder & Director Promotions
Lutz, a Nebraska-based business solutions firm, is proud to announce the promotion of 10 team ...

Nonprofit
Internal Controls for Nonprofit Organizations: Safeguarding Your Mission
Nonprofit organizations operate with a high level of accountability, ensuring every dollar ...

Job Seeker
Career Pivots: How to Identify What Matters Most
Most people don’t follow a perfectly straight career path. Outside of highly specialized ...

Accounting
Trump Accounts: What Families Need to Know
A new savings and investment program called Trump Accounts launched on July 4, 2026, creating ...


Let’s get you where you want to go.
We work to simplify complexities, help make critical business decisions, and confidently focus on the things that are truly important to you. We embrace your business as our own to spark the right solutions and help you thrive.