%20(1).jpg?width=264&height=160&name=Website%20Featured%20Content%20Images%20(2)%20(1).jpg)
%20(1).jpg?width=300&height=175&name=Mega%20Menu%20Image%20(2)%20(1).jpg)
%20(1)-Mar-08-2024-09-27-14-7268-PM.jpg?width=300&height=175&name=Untitled%20design%20(6)%20(1)-Mar-08-2024-09-27-14-7268-PM.jpg)

%20(1)-1.jpg?width=264&height=160&name=Website%20Featured%20Content%20Images%20(2)%20(1)-1.jpg)
-1.jpg?width=264&height=160&name=Website%20Featured%20Content%20Images%20(1)-1.jpg)
%20(1).jpg?width=264&height=160&name=Website%20Featured%20Content%20Images%20(3)%20(1).jpg)
%20(1).jpg?width=264&height=160&name=Website%20Featured%20Content%20Images%20(4)%20(1).jpg)
-Mar-08-2024-08-50-35-9527-PM.png?width=300&height=175&name=Untitled%20design%20(1)-Mar-08-2024-08-50-35-9527-PM.png)


.jpg)


In recent years, investors and advisors have increasingly questioned the need for international diversification. This is likely, at least in part, the result of domestic stocks outperforming their international counterparts for an extended period. Sans a seven-year run of international strength during the mid-2000s, most of the last 30 years have decidedly favored domestic stocks.
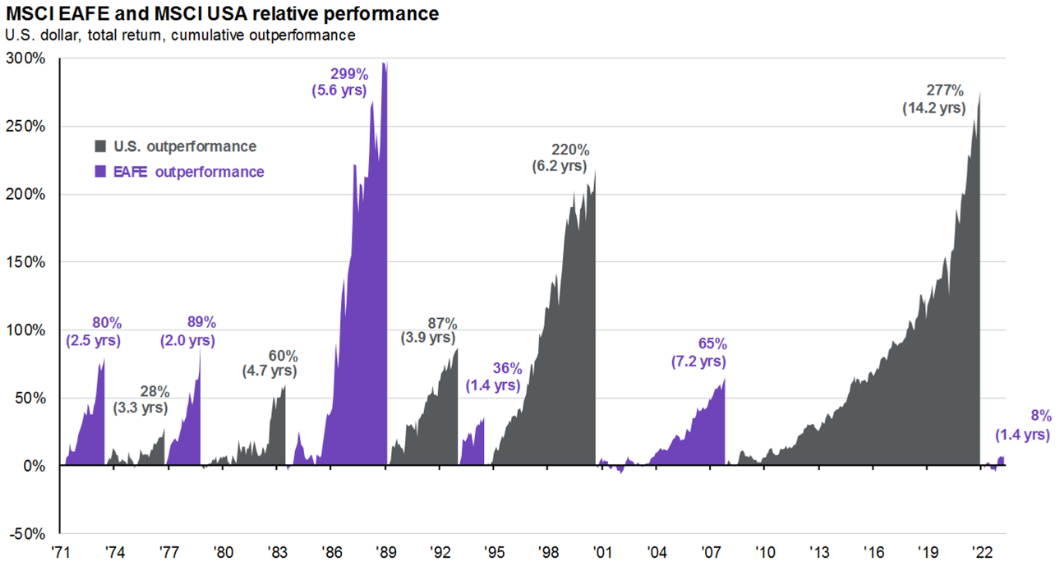
Source: J.P. Morgan Asset Management, FactSet & MSCI. Regime change determined when cumulative outperformance peaks and is not reached again in the subsequent 12-month period. Guide to the Markets – U.S. Data are as of April 30,2023.
More recently, international stocks have finally started to show some signs of life. They began outperforming during 2022, and that relative strength has continued so far this year. Is this a sign of an emerging trend with some staying power? Or will market leadership quickly revert back to U.S. stocks? To answer the question, it is helpful to understand why the U.S. has outperformed for so long in the first place. A recent study published in the Journal of Portfolio Management offers some clues.
Authored by Cliff Asness (and others) from investment firm AQR, the paper is titled ‘International Diversification – Still Not Crazy After All These Years.’ The authors assert that the U.S. stock market hasn’t necessarily outperformed over the last few decades because U.S. businesses are in some way superior. Instead, it identifies changing valuations as the leading reason. The chart below provides some evidence for their conclusion.
Valuations of US and Other Equity Markets, January 1980-February 2023
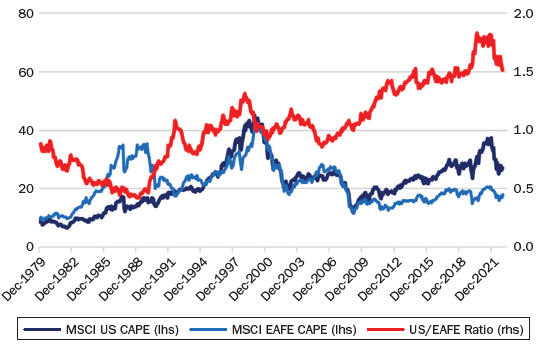
Notes: Country-level CAPE (cyclically adjusted price-to-earnings ratio) metrics are created by comparing the recent equity index price with 10-year past average earnings. The EAFE composite is created by taking country-level data and weighting it according to the MSCI Weights. Additional sources: Bloomberg, MSCI, Consensus Economics & the Journal of Portfolio Management(1)
The two blue lines represent the CAPE ratio (a popular valuation metric) for the U.S. and international markets going back to the late 1970s. Like other valuation metrics, a larger number in this chart signifies an investment is more expensive. As you can see, the light blue line (international) became dislocated in the 1980s, rising far above the dark blue (U.S.) line. During that period, the Japanese market had exploded in value. For a brief time, it accounted for roughly 50% of the global market cap and was the most valuable stock market in the world.
In the long term, valuations tend to revert toward their average level. This is evident between the two blue lines in the above chart. By the early 1990s, the bubble in Japanese share prices popped, and the international CAPE fell back in line with the U.S. CAPE. The two traded roughly in line with each other until the Financial Crisis in 2008. Since that time, another dislocation has formed. This time, it is the U.S. market that has become dislocated.
The market dislocations of the 1980s, as well as the last 15 years, are more easily observed via the red line. This line, measured by the axis on the right side of the graph, reflects the ratio of the two CAPEs. Any number above 1.0 indicates U.S. stocks are more expensive, while numbers below 1.0 indicate international stocks are more expensive.
The red line fell below 0.5 by the late 1980s, signifying the U.S. was trading at more than a 50% discount to international markets. The line has been between 1.5 and 2.0 in recent years, signifying U.S. stocks have been trading at a 150 to 200% premium to international markets. According to the study, this change in relative valuation contributed to the vast majority of international’s underperformance over the last 30 years. Simply put, people have been willing to pay an ever-increasing price for an unchanged share of U.S. stock earnings, which is a trend that has not been sustainable historically.
What implications does this hold for international stocks moving forward? Is there reason to believe the recent outperformance can continue? As mentioned previously, valuations tend to revert to their average over time. If U.S. valuations were to return to historical norms, it would probably favor international market performance.
1. C. Asness, A Illmanen, & D Villalon 2023. “International Diversification – Still Not Crazy After All These Years.” Journal of Portfolio Management 49 (6).
Week in Review
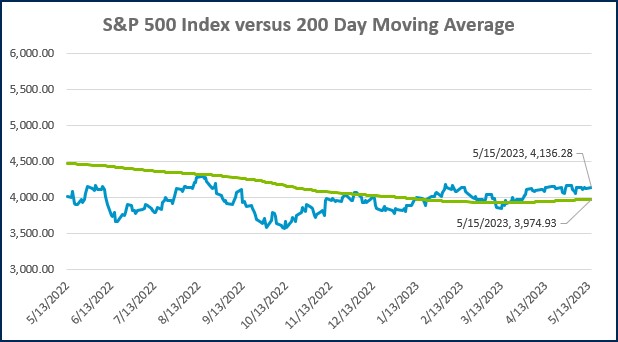
- According to FactSet, 92% of the S&P 500 has reported Q1 results as of last Friday’s close. The earnings growth rate, blended between companies that have already reported with the estimates for those that have yet to report, is at -2.5% year-over-year. Expectations for the earnings growth rate at the onset of earnings season was -6.7% year-over-year. If earnings end the quarter in negative territory, it will mark the second consecutive quarter of negative earnings and push U.S. stocks into an “earnings recession.” Long-term appreciation in the stock market is dependent on the growth of earnings. To get back to a trajectory of sustainable stock market gains, we will need to see a return of earnings growth.
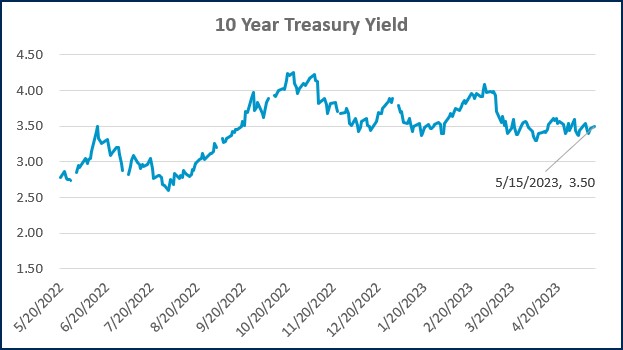
- Data published last week showed the pace of inflation eased somewhat, though it remains well above the Fed’s target. The Consumer Price Index (CPI) increased 4.9% YoY in April, compared to a 5.0% increase in March. Core CPI, which omits the volatile food and energy sectors, increased 5.5% versus the prior month at 5.6%. The market is currently pricing in a pause on further rate increases at the next meeting, with cuts coming as early as September. While the Fed has suggested a pause may be in the cards, it has consistently pushed back against the notion that it will cut rates in the near term.
- Data to be published this week includes retail sales, an update on the housing market, initial jobless claims, and the Index of Leading Economic Indicators. The market may increasingly pay closer attention to the initial jobless claims data, which is seen as an early warning signal for the health of the labor market. Recent prints have been trending higher, suggesting the tightness in the labor market may finally be easing.
Hot Reads
Markets
- Retail Sales Rose 0.4% in April, Less Than Expected As Consumers Struggle With Inflation (CNBC)
- Traders Raise The Chances For a Fed Rate Cut Following April Inflation Report (CNBC)
- Covid Caused Huge Shortages in the Jobs Market. It May Be Easing – But There’s Another Problem Ahead (CNBC)
Investing
- Stock Market Tops, Bottoms & Middles (Ben Carlson)
- The Spectrum of Financial Dependence and Independence (Morgan Housel)
- What’s The Best-Performing Asset Type During a Recession (Morningstar)
Other
- Watch Out: Tornado Alley Is Migrating Eastward (Scientific American)
- The Health Menace Inside Your Sandwich (WSJ)
- What Would An Average Golfer Shoot Hitting a Tour Player’s Drives (YouTube)
Markets at a Glance
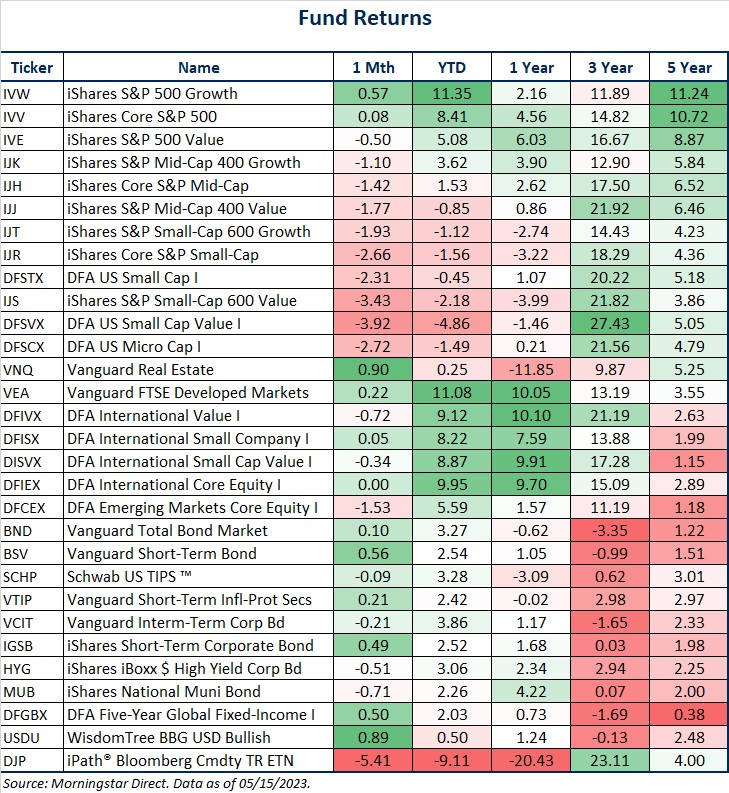
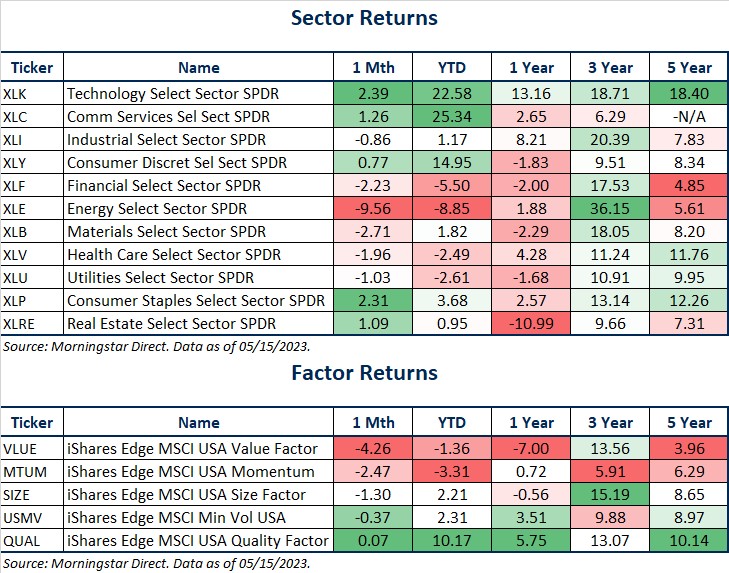
Source: Morningstar Direct.
Source: Morningstar Direct.
Source: Treasury.gov
Source: Treasury.gov
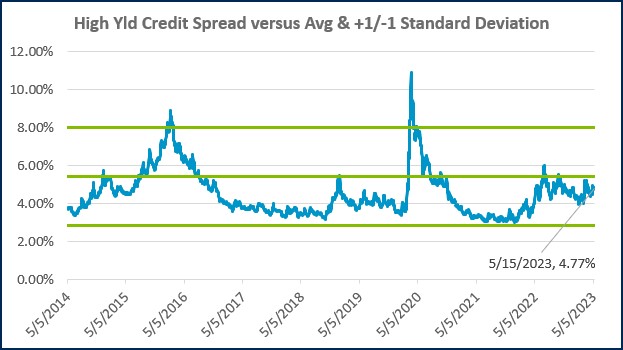
Source: FRED Database & ICE Benchmark Administration Limited (IBA)
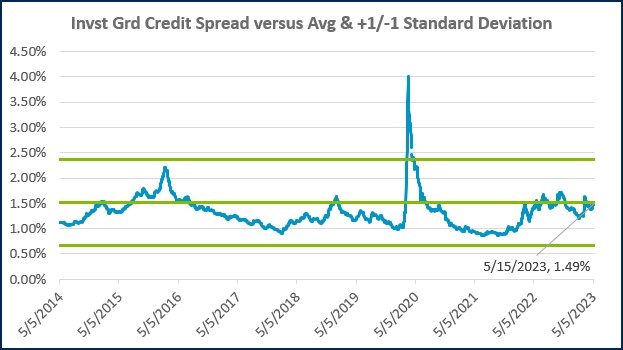
Source: FRED Database & ICE Benchmark Administration Limited (IBA)
Economic Calendar
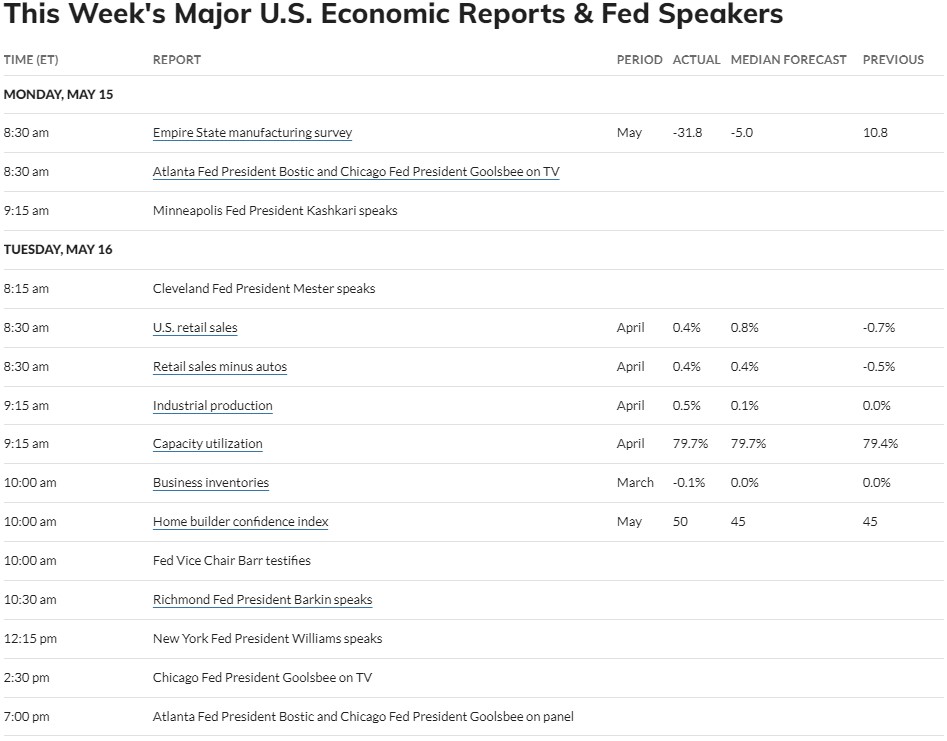
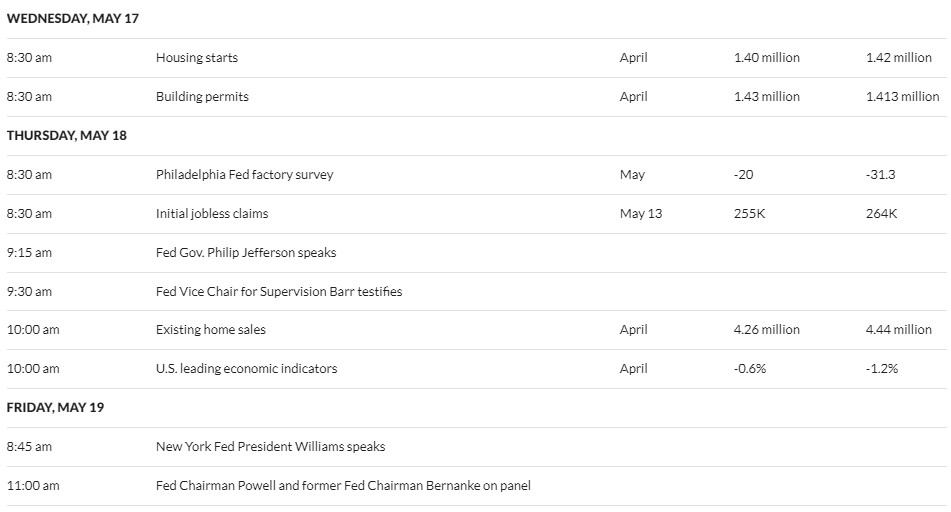
Source: MarketWatch

- Competition, Achiever, Relator, Analytical, Ideation
Josh Jenkins, CFA
Chief Investment Officer, Principal
Josh Jenkins, Chief Investment Officer, began his career in 2010. With a background in investment analysis and portfolio management from his previous roles, he quickly advanced to his current leadership position. As a member of the Lutz Financial Board and Chair of the Investment Committee, he guides Lutz Financial’s investment strategy and helps to manage day-to-day operations.
Leading the investment team, Josh directs research initiatives, while overseeing asset allocation, fund selection, portfolio management, and trading. He authors the weekly Financial Market Update, providing clients with timely insights on market conditions and economic trends. Josh values the analytical nature of his work and the opportunity to collaborate with talented colleagues while continuously expanding his knowledge of the financial markets.
At Lutz, Josh exemplifies the firm’s commitment to maintaining discipline and helping clients navigate market uncertainties with confidence. While staying true to the systematic investment process, he works to keep clients' long-term financial goals at the center of his decision-making.
Josh lives in Omaha, NE. Outside the office, he likes to stay active, travel, and play golf.
Recent News & Insights

QuickBooks
QuickBooks Online Checklist
Is QuickBooks Online right for you? QuickBooks Online can help you better manage your business ...

Accounting
What You Need to Know About the IRS’s CP53E Notices
The IRS has begun issuing CP53E Notices following a recent executive order directing federal ...

Manufacturing
Data-Driven Inventory Management: Using Power BI to Optimize Cash Flow & Financing
Inventory is one of the largest uses of cash for many businesses, yet it’s often managed with ...

Recent News
Duren & Martinson Named Forbes 2026 Best‑in‑State CPAs
Lutz is proud to announce that Mark Duren and Kelly Martinson have been named to the 2026 ...


Let’s get you where you want to go.
We work to simplify complexities, help make critical business decisions, and confidently focus on the things that are truly important to you. We embrace your business as our own to spark the right solutions and help you thrive.