%20(1).jpg?width=264&height=160&name=Website%20Featured%20Content%20Images%20(2)%20(1).jpg)
%20(1).jpg?width=264&height=160&name=Website%20Featured%20Content%20Images%20(4)%20(1).jpg)
-Mar-08-2024-08-50-35-9527-PM.png?width=300&height=175&name=Untitled%20design%20(1)-Mar-08-2024-08-50-35-9527-PM.png)

%20(1)-1.jpg?width=264&height=160&name=Website%20Featured%20Content%20Images%20(2)%20(1)-1.jpg)
-1.jpg?width=264&height=160&name=Website%20Featured%20Content%20Images%20(1)-1.jpg)
%20(1).jpg?width=264&height=160&name=Website%20Featured%20Content%20Images%20(3)%20(1).jpg)


.jpg)


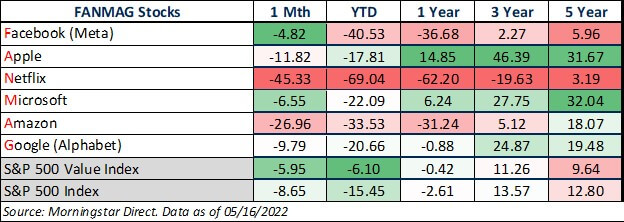
It has been a very tough start to the year for a handful of extremely popular large-growth companies. Collectively known by the acronym ‘FANMAG,’ the group includes Facebook (Meta), Apple, Netflix, Microsoft, Amazon, and Google (Alphabet). In recent years they have posted some eye-popping returns but have largely struggled as of late.
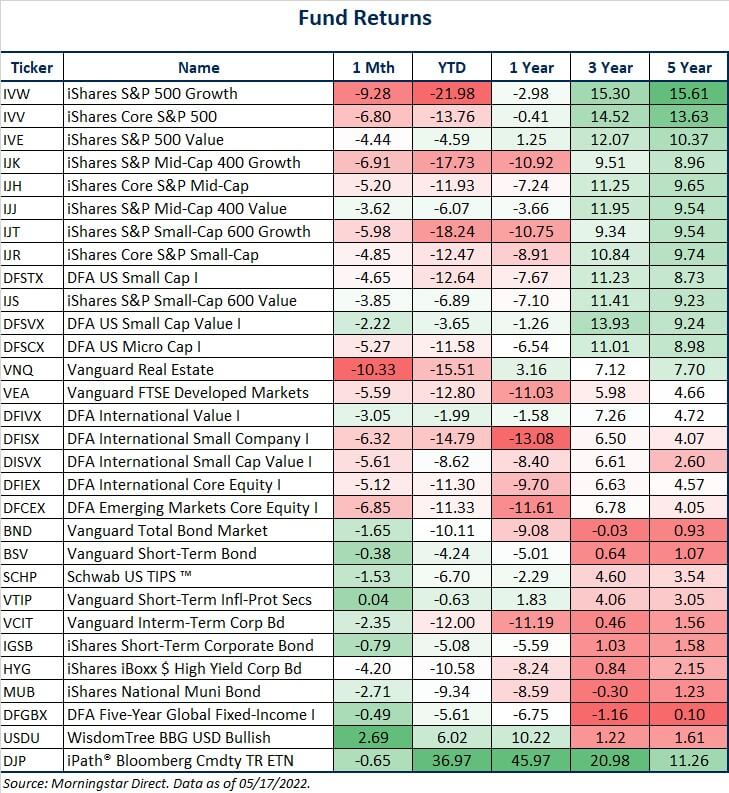
As the table below illustrates, the five-year returns generated by the FANMAGs have generally exceeded the market, represented by the S&P 500. Netflix and Facebook are notable exceptions due to large year-to-date losses. So far in 2022, Facebook has shed 40.5% of its value, while Netflix is down a gut-wrenching 69.0%. While not down nearly as much, the others are underperforming the market year-to-date as well.
The chart below illustrates the reversal of fortune for the FANMAGs in another way. The line represents the cumulative outperformance relative to the S&P 500. Looking at this chart, it’s not hard to see why they garnered their own acronym. From May 2017 through November of last year, they beat the S&P 500 by nearly 200%, which itself was up over 100% during the period! Since the peak last November, however, the decline has been swift. By the end of April, the FANMAGs have given back nearly all their outperformance since the depths of the pandemic-related market crash (early 2020).
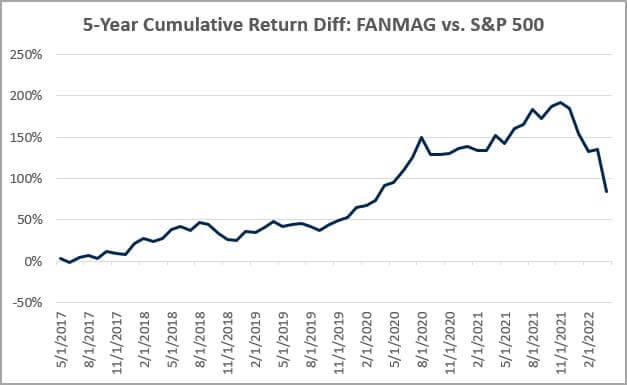
Source: Morningstar Direct as of 4/30/2022. Returns are cumulative & calculated monthly. The FANMAG return is based on an equally weighted portfolio of the six component companies.
There are a variety of reasons these companies have been under substantial pressure. The Federal Reserve’s policy shift aimed at combating inflation has arguably been the most prominent cause, with rising rates hitting high growth companies hardest. When investors purchase a growth stock, they are usually doing so based on the expectation of a large potential payoff far in the future rather than substantial earnings and shareholder distributions today. Consequently, growth stocks have higher duration (more interest rate sensitivity) than value stocks in a similar way that long-term bonds are higher duration than short-term bonds.
Another reason for the struggling performance relates to poor earnings reports and forward guidance. In February, Facebook (Meta) fell 26% in a single day after the company forecasted weaker than expected revenue growth. In April, Netflix fell 35% in a day after reporting the first quarterly loss of subscribers in over ten years. Later in April, Amazon posted its worst trading day since 2006, falling 14% following its 1st quarter earnings report. A major impediment to continued growth for these firms is the fact that they increasingly compete with each other. Two or more of these companies compete in each of the following markets: streaming services, cloud computing, and search.
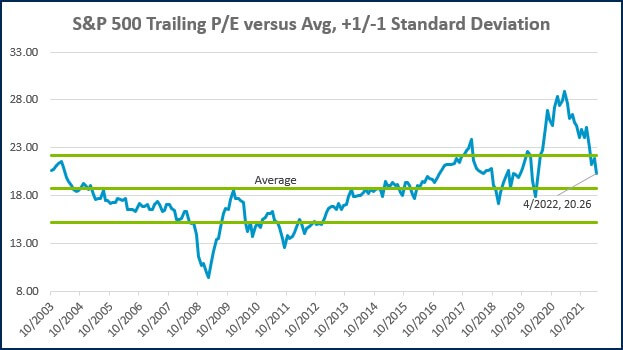
The chart below provides some insight into why the FANMAG stocks have been punished so brutally following earnings reports. It illustrates the valuation of the top 10 stocks of the S&P 500 vs. the remaining companies and the Index as a whole. Though the top 10 don’t perfectly align with the FANMAGs, it is still representative given the substantial overlap. As you can see, there have been two periods in recent decades where the valuations of the top 10 have become significantly dislocated from the rest of the market. The first period was during the technology bubble in the late 1990s, and the second period is ongoing. Extreme optimism on the part of investors is required to push relative valuations to such an extreme. When companies fail to deliver on those stratospheric expectations, the snapback can be jarring. While valuations did not quite reach the same extremes this time around, they seem to be deflating with speed reminiscent of the prior episode.
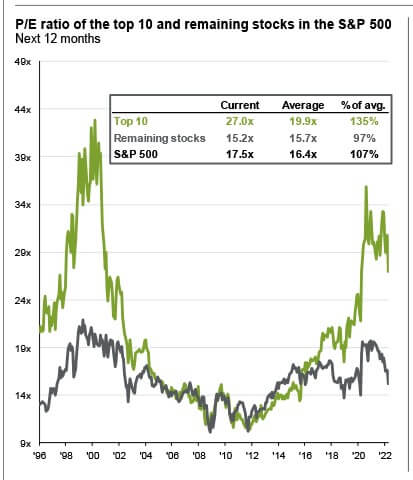
Source: J.P. Morgan Asset Management. The top 10 S&P 500 companies are based on the 10 largest index constituents at the beginning of each month. The weight of these companies is revised monthly. As of 3/31/2022, the top 10 companies in the index were AAPL (7.1%), MSFT (6.0%), AMZN (3.7%), TSLA (2.4%), GOOGL (2.2%), GOOG (2.0%), NVDA (1.8%), BRK.B (1.7%), FB (1.3%), UNH (1.3%), and JNJ (1.2%). The remaining stocks represent the rest of the 494 companies in the S&P 500
It may be tempting to purchase some of the FANMAGs following their steep declines over the last few months. It is certainly possible they will regain their operational footing and recapture investor imaginations. Still, there is some risk that there is a substantial way to fall from here before valuations move back in line with where the rest of the market is trading.
WEEK IN REVIEW
- In an interview with the WSJ yesterday, Chairmen Jerome Powell reiterated the Federal Reserve’s resolve in combating inflation, saying, “if that involves moving past broadly understood levels of neutral we won’t hesitate to do that.” The market is currently pricing in another 0.50% hike at the next Fed meeting in mid-June and a 2.75 to 3.00% level for Fed Funds by year-end.
- Retail sales data published Tuesday morning showed spending increased by 0.9% vs. expectations of a 1.0% increase. Excluding the volatile autos, building materials and gas rose 1.2% and were up 1.6%, including revisions to prior months. This figure is generally considered robust, but after adjusting for inflation, YoY retail sales were largely flat.
- Major economic data to be published later in the week includes housing starts and building permits on Wednesday, as well as jobless claims, existing home sales, and the Index of Leading Economic Indicators on Thursday.
ECONOMIC CALENDAR

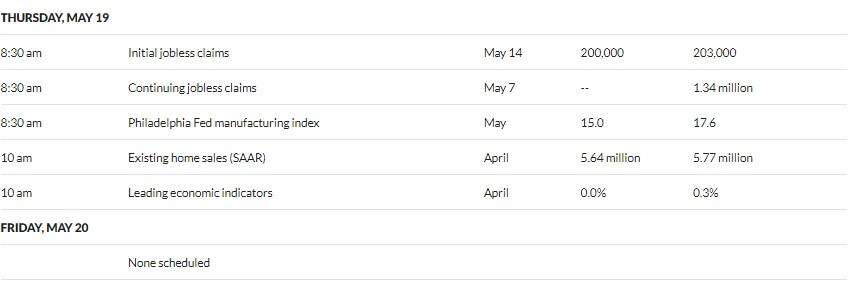
Source: MarketWatch
HOT READS
Markets
- Retail Spending Increased 0.9% in April, Boosted by Demand and inflation (CNBC)
- Powell Says the Fed Will Not Hesitate to Keep Raising Rates Until Inflation Comes Down (CNBC)
- Warren Buffett Spends Big as Stock Market Sells Off (WSJ)
Investing
- What to Know if You Want to Buy the Stock Market Dip (WSJ)
- The Next Recession (Ben Carlson)
- Trying too Hard (Morgan Housel)
Other
- A Physical Therapist to the Stars, Esther Lee is Now Facing Down Death (Sports Illustrated)
- How the Brain Tells Apart Important and Unimportant Sensations (Scientific American)
- People Are Dating All Wrong, According to Data Science (Wired)
MARKETS AT A GLANCE
Source: Morningstar Direct.
Source: Morningstar Direct.
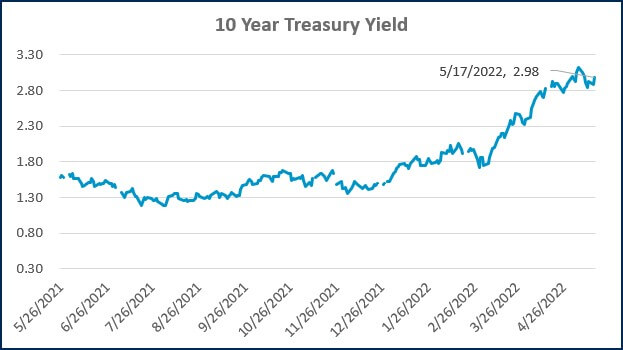
Source: Treasury.gov
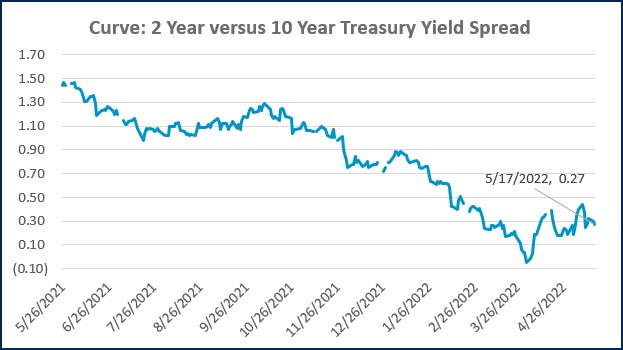
Source: Treasury.gov

Source: FRED Database & ICE Benchmark Administration Limited (IBA)
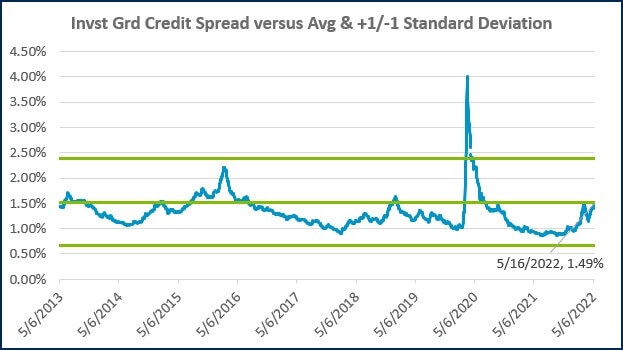
Source: FRED Database & ICE Benchmark Administration Limited (IBA)

- Competition, Achiever, Relator, Analytical, Ideation
Josh Jenkins, CFA
Josh Jenkins, Chief Investment Officer, began his career in 2010. With a background in investment analysis and portfolio management from his previous roles, he quickly advanced to his current leadership position. As a member of the Lutz Financial Board and Chair of the Investment Committee, he guides Lutz Financial’s investment strategy and helps to manage day-to-day operations.
Leading the investment team, Josh directs research initiatives, while overseeing asset allocation, fund selection, portfolio management, and trading. He authors the weekly Financial Market Update, providing clients with timely insights on market conditions and economic trends. Josh values the analytical nature of his work and the opportunity to collaborate with talented colleagues while continuously expanding his knowledge of the financial markets.
At Lutz, Josh exemplifies the firm’s commitment to maintaining discipline and helping clients navigate market uncertainties with confidence. While staying true to the systematic investment process, he works to keep clients' long-term financial goals at the center of his decision-making.
Josh lives in Omaha, NE. Outside the office, he likes to stay active, travel, and play golf.
Recent News & Insights

Lutz Announces 2026 Shareholder & Director Promotions

Internal Controls for Nonprofit Organizations: Safeguarding Your Mission

Career Pivots: How to Identify What Matters Most

Trump Accounts: What Families Need to Know

