%20(1).jpg?width=264&height=160&name=Website%20Featured%20Content%20Images%20(2)%20(1).jpg)
%20(1).jpg?width=300&height=175&name=Mega%20Menu%20Image%20(2)%20(1).jpg)
%20(1)-Mar-08-2024-09-27-14-7268-PM.jpg?width=300&height=175&name=Untitled%20design%20(6)%20(1)-Mar-08-2024-09-27-14-7268-PM.jpg)

%20(1)-1.jpg?width=264&height=160&name=Website%20Featured%20Content%20Images%20(2)%20(1)-1.jpg)
-1.jpg?width=264&height=160&name=Website%20Featured%20Content%20Images%20(1)-1.jpg)
%20(1).jpg?width=264&height=160&name=Website%20Featured%20Content%20Images%20(3)%20(1).jpg)
%20(1).jpg?width=264&height=160&name=Website%20Featured%20Content%20Images%20(4)%20(1).jpg)
-Mar-08-2024-08-50-35-9527-PM.png?width=300&height=175&name=Untitled%20design%20(1)-Mar-08-2024-08-50-35-9527-PM.png)


.jpg)


After an incredibly strong run for smaller, more value-tilted companies through the end of last year, 2023 has been dominated by a select group of large growth stocks. Eight in particular, including Apple, Microsoft, Amazon, NVIDIA, the two share classes of Alphabet (Google), Meta (Facebook), and Tesla, have been responsible for a substantial portion of the overall market’s gains year-to-date. Is it time for investors to jump on the bandwagon of these growth stocks? Or is there a reason to be weary despite their recent success?
Before we dive in, it is worth focusing on just Apple for a moment. While it is still below its peak dollar value achieved at the end of 2021, its current $2.72 trillion value as a percent of the total market is higher. To put its impressive relative size into context, here are a few interesting stats:
- At the end of 2021, Apple’s value was $2.91 trillion (6.9% of the S&P 500). As of May 19th, Apple’s value was 2.76 trillion (7.4% of the S&P 500)(1).
- The United Kingdom is the 3rd most valuable developed stock market in the world, behind the US and Japan. The total value of all the companies in the UK’s stock market is $2.83 trillion, roughly equivalent to Apple’s value(2).
- The total value of the S&P 400 Index of US mid-cap stocks is just $2.28 trillion(3).
- Apple is so large that for every 1% +/- move in its stock price, the value of the company changes by an amount roughly equivalent to the median S&P 500 company’s value.
- With the price of Apple’s stock up 34.5% so far this year, its total market value has increased by $843 billion. The only companies on the planet with a value greater than $843 billion are Microsoft, Amazon, and Alphabet (Google).
While the sheer size of Apple is staggering, its Year-to-Date (YTD) return is fairly pedestrian when compared to some of the other large growth companies at the top of the S&P 500. A select group of these stocks is illustrated in the table below. Apple’s YTD return is actually the lowest on the list. Chip maker NVIDIA and social media company Meta have both more than doubled in value so far this year.
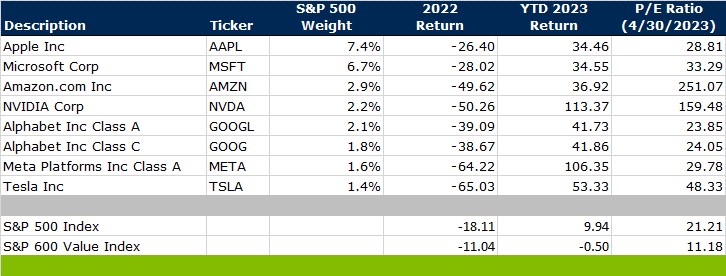
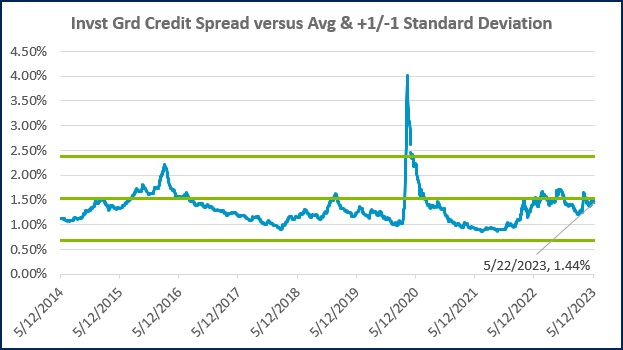
Source: Morningstar Direct. P/E ratio data as of 4/30. All returns are cumulative. YTD 2023 return is through 5/22/2023. S&P 500 weight data as of 5/22/2022, and reflects the equity weights of the iShares Core S&P 500 ETF.
What has led to these staggering returns at a time when nearly half of all S&P 500 companies have lost money in 2023? There are a variety of potential factors:
- These companies were among the worst performers in 2022 and may have been oversold.
- Expectations for the future path of Federal Reserve policy have changed. The market is now anticipating a high likelihood of a pause in hikes and potentially even some cuts later this year. This development may benefit longer-duration growth stocks the most.
- Turmoil in the banking sector adversely affected many other areas of the market but left large growth relatively unscathed.
- The arrival of powerful new artificial intelligence tools in the mainstream benefits the creators of those tools, as well as the chip makers that will power them.
While there is probably some degree of truth for each of the above reasons, there is one catalyst that likely dominates all others: a change in valuations. This can be observed in the chart below, which illustrates the change in the Price-to-earnings (P/E) ratio over the course of the year. 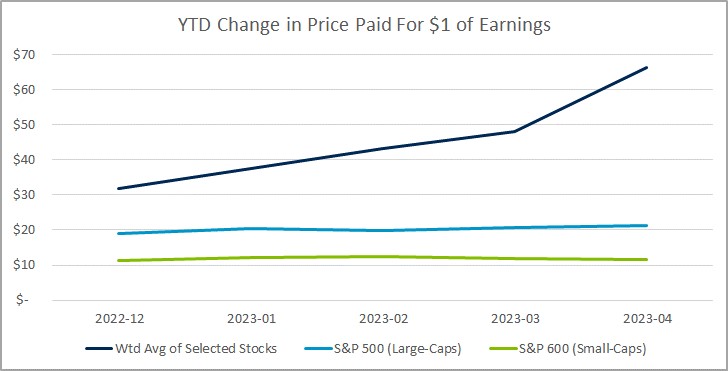
Source: Morningstar Direct. P/Es are based on monthly data from 12/31/2022 through 4/30/2023. The selected stocks include AAPL, MSFT, AMZN, NVDA, GOOGL, GOOG, EMTA & TSLA. The blended P/E was weighted by their weight in the iShares Core S&P 500 ETF as of 5/22/2023.
The dark blue line represents the weighted average P/E ratio of the eight stocks from the previous table. The P/E ratio can be interpreted as how much an investor must pay for $1 of earnings from the prior 12 months. This price paid is typically a multiple of earnings because buying now allows an investor to participate in all future earnings, which often grow over time.
At the end of 2022, the average P/E ratio of the selected stocks was roughly 32. This represents a notable premium over the price of both the large-cap stocks of the broader S&P 500 (light blue line) and the small-cap stocks of the S&P 600 (green line).
This premium alone isn’t surprising. Investors are typically willing to pay more for companies that have demonstrated the ability to rapidly grow earnings. What is surprising, however, is what has happened to this premium since the start of the year:
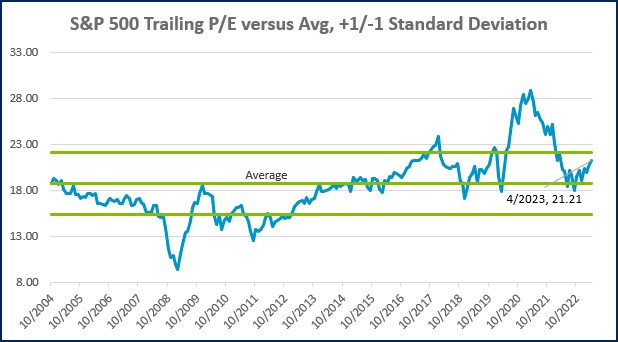
- The S&P 500 P/E increased from 19.03 to 21.21
- The S&P 600 P/E increased from 11.36 to 11.71
- The selected stocks increased from 31.84 to 66.36
While the price paid for the broad market of large and small-cap stocks remains essentially unchanged, it has exploded higher for the selected stocks. In fact, it has more than doubled in just the first four months of the year! This is a very large increase in a very short period. Importantly, shares of these companies are not rising for fundamental reasons, such as improved past earnings results. Instead, their prices are rising because investors are becoming more optimistic and have been willing to pay an increasingly higher premium.
As discussed previously, rising expectations for growth can support a higher premium. A serious problem arises, however, when those expectations become too rosy. As expectations are elevated, so too is the bar on what a company must achieve to support that higher price. If the price rises to a point that requires ‘spectacular’ operating results to justify, and merely ‘very good’ results are achieved, you can see a correction lower in price.
Lofty valuations make share prices vulnerable to even small bumps in the road. Conversely, relatively low valuations can make share prices resilient to headwinds. This played out in a major way last year. By the end of 2021, the extremely speculative behavior of investors throughout the post-Covid recovery had bid the valuation of growth stocks to nosebleed levels. Smaller, value-titled companies, meanwhile, were largely overlooked. When investor sentiment shifted to a much more pessimistic mood, large growth was hammered relative to small value.
The select group of growth stocks highlighted here have been the fuel powering the market higher in 2023. An extremely optimistic outlook for their future has encouraged investors to pay an ever-increasing premium to participate in their future results. Unfortunately, rising valuations have not historically been a sustainable source of wealth creation. Investors looking to pile in now should be weary of a repeat of the painful repricing that occurred in 2022.
(1)(2)(3) Data from S&P Dow Jones Indices
Week in Review
- According to FactSet, 95% of the S&P 500 has reported Q1 results as of last Friday’s close. The earnings growth rate, blended between companies that have already reported with the estimates for those that have yet to report, is at -2.2% year-over-year. Expectations for the earnings growth rate at the onset of earnings season was -6.7% year-over-year. Long-term appreciation in the stock market is dependent on the growth of earnings. To get back to a trajectory of sustainable stock market gains, we will need to see a return of earnings growth.
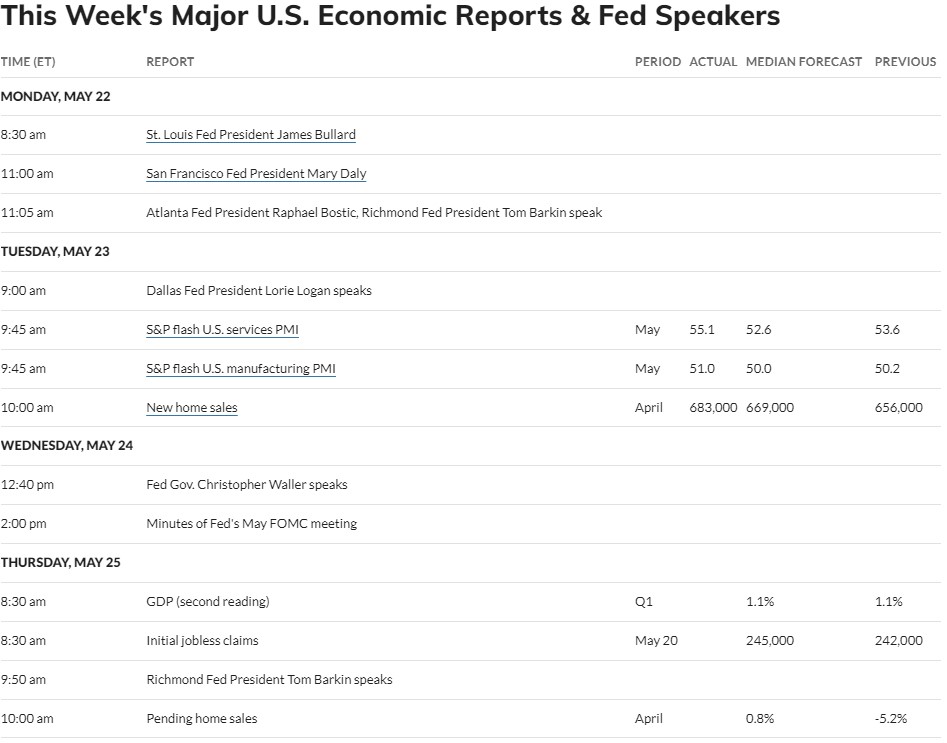
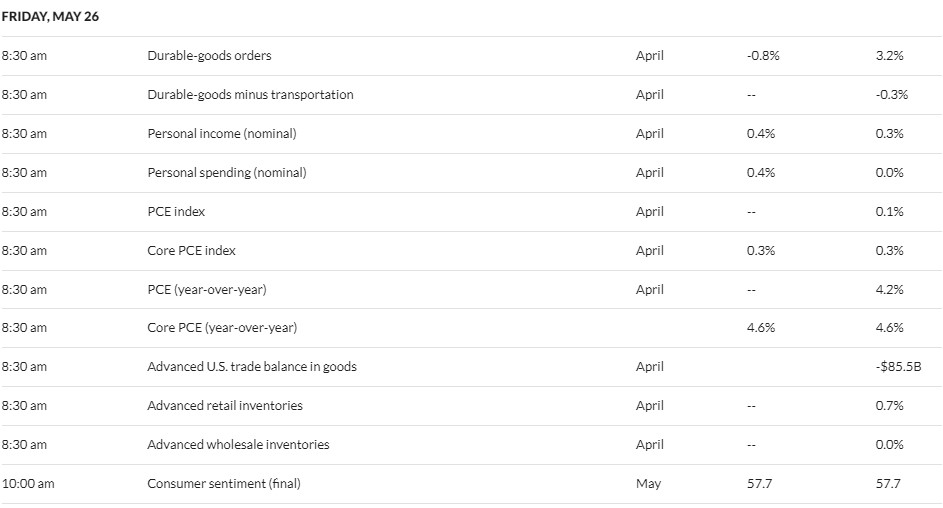
- Data to be published later this week includes the second revision of Q1 GDP, initial jobless claims, durable goods orders, and the Personal Consumption Expenditures (PCE) Index, which represents the Fed’s preferred gauge of inflation.
- Later this week, the Fed will publish the minutes to the last monetary policy meeting, which investors will scan for clues on the path of future policy. Following the last meeting, Fed Chairman Jerome Powell alluded to the possibility of a pause in the rate hiking cycle. The market is currently pricing in a 28% chance for a hike at the next meeting.
Hot Reads
Markets
- Former Fed Chair Ben Bernanke Says There’s More Work Ahead to Control Inflation (CNBC)
- Fed Chair Powell Says Rates May Not Have to Rise as Much as Expected to Curb Inflation (CNBC)
- Why Inflation Erupted: Two Top Economists Have the Answer (WSJ)
Investing
- The Stock Market Usually Goes Up (But Sometimes it Goes Down) (Ben Carlson)
- The Spectrum of Financial Dependence and Independence (Collaborative Fund)
- Why You Keep Chasing the Wrong Market (Jason Zweig)
Other
- The Public Golf Course Pro Who Shocked the PGA Championship (WSJ)
- Tim Donaghy: The Ref Who Bet On NBA Games; Legal Sports Betting Hits U.S. – 60 Minutes (YouTube)
- How AI Knows Things No One Told It (Scientific American)
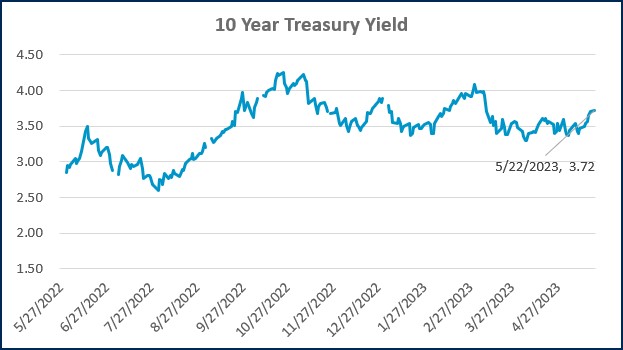
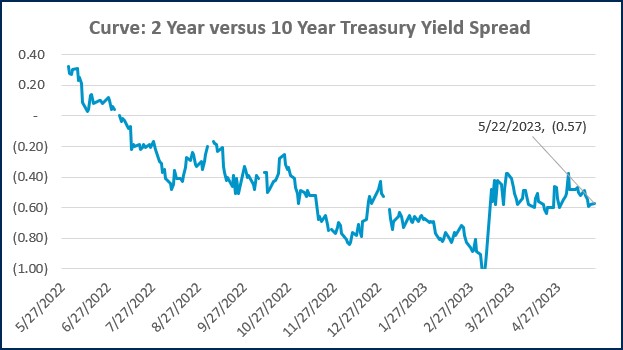
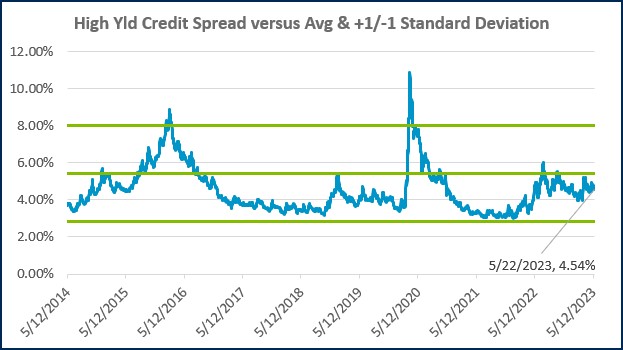
Markets at a Glance

Source: Morningstar Direct.
Source: Morningstar Direct.
Source: Treasury.gov
Source: Treasury.gov
Source: FRED Database & ICE Benchmark Administration Limited (IBA)
Source: FRED Database & ICE Benchmark Administration Limited (IBA)
Economic Calendar
Source: MarketWatch

- Competition, Achiever, Relator, Analytical, Ideation
Josh Jenkins, CFA
Chief Investment Officer, Principal
Josh Jenkins, Chief Investment Officer, began his career in 2010. With a background in investment analysis and portfolio management from his previous roles, he quickly advanced to his current leadership position. As a member of the Lutz Financial Board and Chair of the Investment Committee, he guides Lutz Financial’s investment strategy and helps to manage day-to-day operations.
Leading the investment team, Josh directs research initiatives, while overseeing asset allocation, fund selection, portfolio management, and trading. He authors the weekly Financial Market Update, providing clients with timely insights on market conditions and economic trends. Josh values the analytical nature of his work and the opportunity to collaborate with talented colleagues while continuously expanding his knowledge of the financial markets.
At Lutz, Josh exemplifies the firm’s commitment to maintaining discipline and helping clients navigate market uncertainties with confidence. While staying true to the systematic investment process, he works to keep clients' long-term financial goals at the center of his decision-making.
Josh lives in Omaha, NE. Outside the office, he likes to stay active, travel, and play golf.
Recent News & Insights

QuickBooks
QuickBooks Online Checklist
Is QuickBooks Online right for you? QuickBooks Online can help you better manage your business ...

Accounting
What You Need to Know About the IRS’s CP53E Notices
The IRS has begun issuing CP53E Notices following a recent executive order directing federal ...

Manufacturing
Data-Driven Inventory Management: Using Power BI to Optimize Cash Flow & Financing
Inventory is one of the largest uses of cash for many businesses, yet it’s often managed with ...

Recent News
Duren & Martinson Named Forbes 2026 Best‑in‑State CPAs
Lutz is proud to announce that Mark Duren and Kelly Martinson have been named to the 2026 ...


Let’s get you where you want to go.
We work to simplify complexities, help make critical business decisions, and confidently focus on the things that are truly important to you. We embrace your business as our own to spark the right solutions and help you thrive.