%20(1).jpg?width=264&height=160&name=Website%20Featured%20Content%20Images%20(2)%20(1).jpg)
%20(1).jpg?width=300&height=175&name=Mega%20Menu%20Image%20(2)%20(1).jpg)
%20(1)-Mar-08-2024-09-27-14-7268-PM.jpg?width=300&height=175&name=Untitled%20design%20(6)%20(1)-Mar-08-2024-09-27-14-7268-PM.jpg)

%20(1)-1.jpg?width=264&height=160&name=Website%20Featured%20Content%20Images%20(2)%20(1)-1.jpg)
-1.jpg?width=264&height=160&name=Website%20Featured%20Content%20Images%20(1)-1.jpg)
%20(1).jpg?width=264&height=160&name=Website%20Featured%20Content%20Images%20(3)%20(1).jpg)
%20(1).jpg?width=264&height=160&name=Website%20Featured%20Content%20Images%20(4)%20(1).jpg)
-Mar-08-2024-08-50-35-9527-PM.png?width=300&height=175&name=Untitled%20design%20(1)-Mar-08-2024-08-50-35-9527-PM.png)


.jpg)


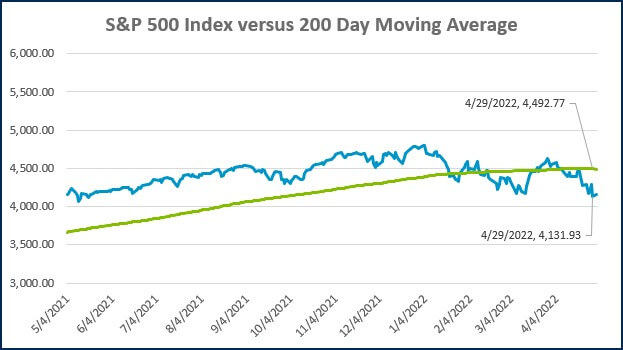
The stock market has been experiencing some heightened volatility recently. The S&P 500, which represents domestic large-cap stocks, is down over 13% from the highs in early January. Understandably, this has many investors on edge. With this in mind, we thought it would be beneficial to put the recent volatility in perspective.
There are a variety of reasons that may explain the market weakness. A few of the leading candidates include:
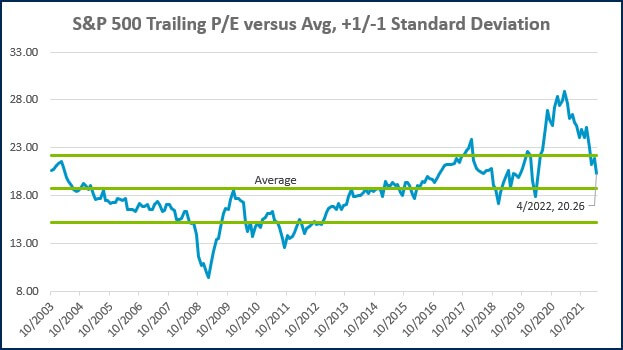
- Elevated stock valuations
- Tightening monetary policy
- High inflation
- Supply chain disruption
- The Covid Outbreak in China
- The war in Ukrain
Each of these risks has likely made an impact on stock prices, though it is impossible to attribute any one factor to specific market gyrations. While the current environment seems unique, most of the above items have occurred at some point(s) in the past. An investor could produce a similar-sized list of risks at virtually any point in history. The major difference is that when market sentiment is optimistic, investors generally just ignore the looming risks. When sentiment sours, market participants begin to fixate on the potential downside.
Volatility is a common feature of the market. It is impossible to predict in advance when it will arise, but it is generally a safe bet to assume that it will from time to time. This is demonstrated in the table below, which highlights the frequency of varying degrees of market declines over the last 75+ years. As you can see, a 5-10% dip has historically occurred more than once a year on average. A decline of 10-20% has occurred every two to three years on average. A 20-40% decline has historically occurred every eight to nine years, while the largest declines have occurred every twenty-five years.
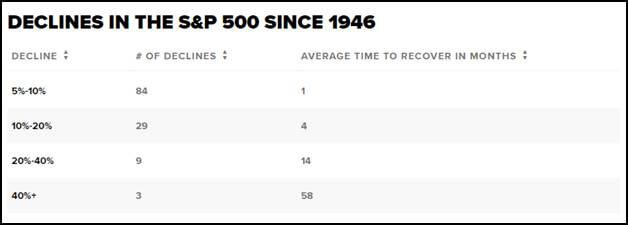
Source: CNBC / Guggenheim
Although declines in the market are clearly a common occurrence, many investors feel compelled to try and avoid them. The desire to do this is rational, but successful market timing is extremely challenging, and failed attempts can come at a high cost. The chart below demonstrates this. It illustrates the growth of $1,000 invested in the S&P 500 from 1990 through 2019.
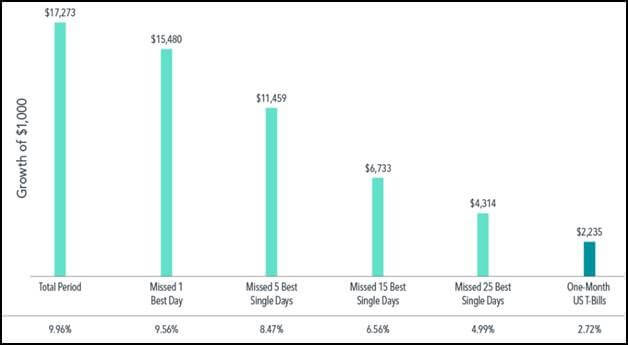
Source: Dimensional Fund Advisors. In US dollars. For illustrative purposes. The missed best day(s) examples assume that the hypothetical portfolio fully divested its holdings at the end of the day before the missed best day(s), held cash for the missed best day(s), and reinvested the entire portfolio in the S&P 500 at the end of the missed best day(s). Annualized returns for the missed best day(s) were calculated by substituting actual returns for the missed best day(s) with zero. S&P data © 2019 S&P Dow Jones Indices LLC, a division of S&P Global. All rights reserved. One-Month US T-Bills is the IA SBBI US 30 Day TBill TR USD, provided by Ibbotson Associates via Morningstar Direct.
The total return during the period was 9.96% per year, as shown by the column furthest to the left. Earning that return over the 30-year period would have grown the starting value of $1,000 to $17,273. Had an investor missed out on the single best day, their return for the entire period would have declined to 9.56% per year, and their ending value would have only been $15,480. If five of the best days were missed, the annualized return would have been 8.47%, and the ending value would have declined to $11,459. To say that another way, by missing the five best days over a 30-year period, an investor would have cut the appreciation of their wealth by a third! You can see that the negative impact on an investor’s outcome continues to get dramatically worse as the number of good market days missed increases.
Investors attempting to time the market risk the fate demonstrated above in a variety of ways:
- The anticipated decline in the market may never materialize
- The anticipated decline occurs, but only after an extended period of further gains
- The decline has fully occurred by the time the investor exits (the investor sells at the bottom)
- The investor successfully gets out ahead of the decline but remains out during the subsequent rally
As the bullets above demonstrate, to successfully time the market, an investor must be correct twice. They must forecast the right time to get out, as well as the right time to get back in. Investors tend to fixate on the first decision with little thought given to the latter. Unfortunately, there is no reliable signal to notify investors when it is time to get back into the market. Consider all of the gains forgone by an investor that did not get reinvested after selling during the technology bubble, financial crisis, or pandemic sell-off.
Staying invested can be uncomfortable when stock prices are falling. At the end of the day, volatility is a normal and healthy feature of the market. It keeps a lid on excessive speculation, which can lead to crashes. It also resets valuations lower and positions the market to continue appreciating in a sustainable manner. Investors that can stick to their plan have historically been rewarded for doing so.
WEEK IN REVIEW
- The Federal Reserve’s meeting on monetary policy will conclude tomorrow and will be followed by a press conference with Chair Jerome Powell. The market is pricing in a 0.50% hike with near certainty. If they follow through with this expectation, it would be the largest rate hike in decades. Although this hike is already priced in, Powell has the potential to move markets if he provides more clarity on how high the Fed thinks rates are going. The Fed is also expected to announce plans on how to wind down its bond portfolio.
- As of Friday, 55% of companies in the S&P 500 have reported earnings for the 1st quarter. Earnings growth was initially expected to be +4.7%, but companies have been outperforming in aggregate. Earnings growth for companies that have reported, blended with the estimates for companies that have yet to report, is 7.1%. Interestingly, if you stripped out the weak Amazon report, the blended growth rate would be 10.1%.
- Data published last week showed a decline in GDP of 1.4% (annualized). While the headline may stoke fears that we are already entering a recession, the details of the report were not as bad. The decline was primarily caused by a huge surge in imports and reduced government spending. Consumer spending (+2.7%) and business investment (+9.2%) were both positive during the quarter, and suggest the potential for a rebound in the second quarter.
ECONOMIC CALENDAR
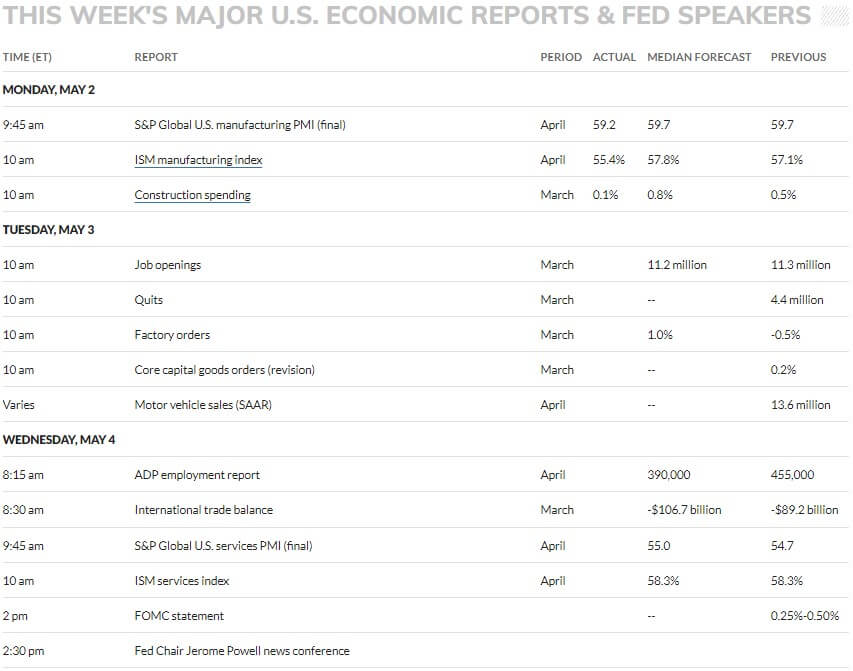
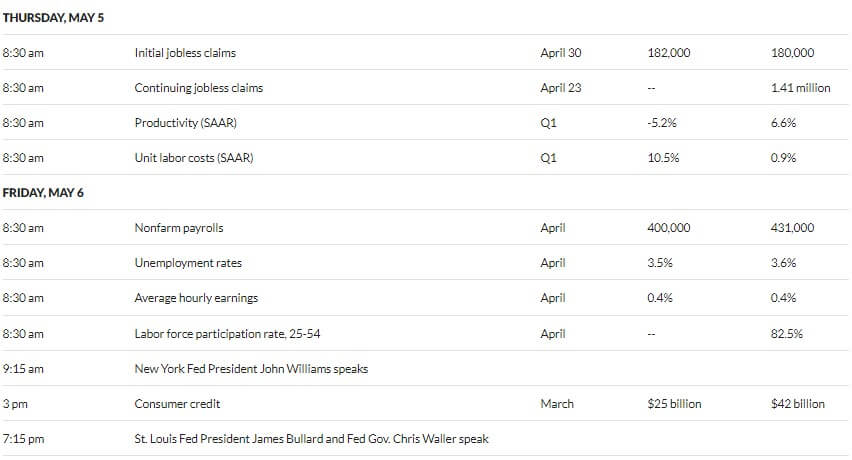
Source: MarketWatch
HOT READS
Markets
- Fed Prepares Double-Barreled Tightening With Bond Runoff (WSJ)
- U.S. GDP Fell at a 1.4% Pace to Start The Year as Pandemic Recovery Takes Hit (CNBC)
- The Fed’s Favorite Inflation Gauge Rose 5.2% in March as Worker Pay Fell Further Behind (CNBC)
Investing
- The Rich and the Wealthy (Morgan Housel)
- Comparing Two Blowups (Irrelevant Investor)
- Ominous Predictions (Humble Dollar)
Other
- Big Money Donors Have Stepped Out of the Shadows to Create ‘Chaotic’ NIL Market (SI)
- Everything’s a WeWork Now (Wired)
- Dogs’ Personalities Aren’t Determined by Their Breed (Scientific American)
MARKETS AT A GLANCE
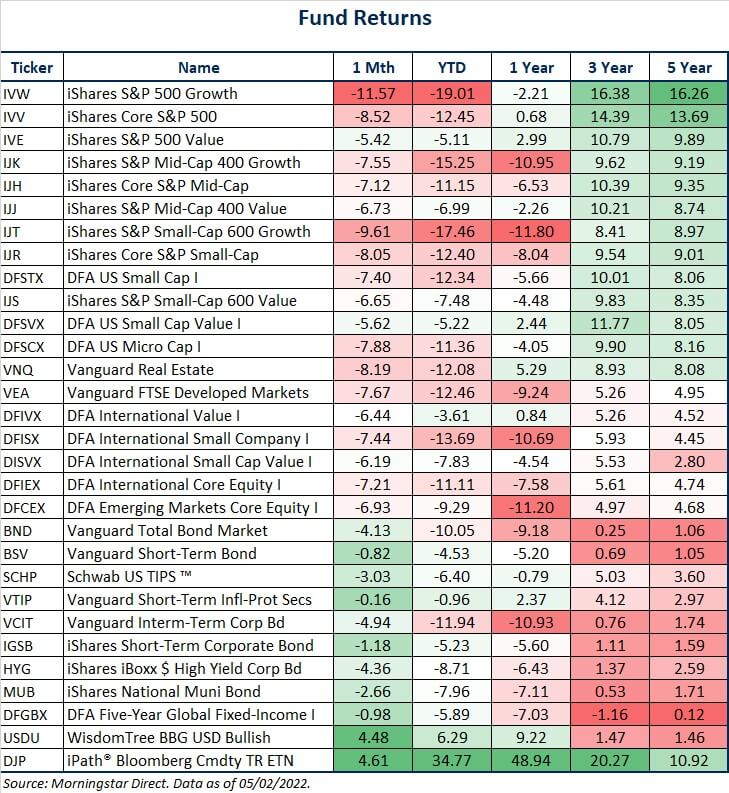
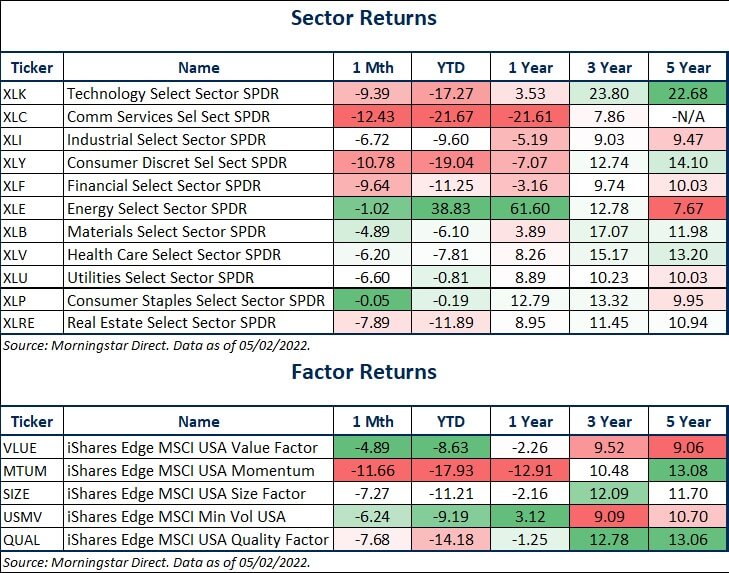
Source: Morningstar Direct.
Source: Morningstar Direct.
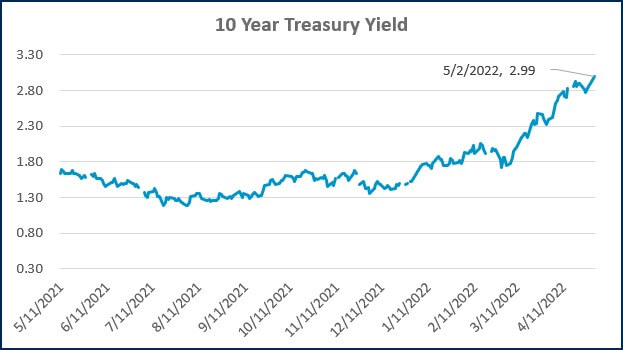
Source: Treasury.gov
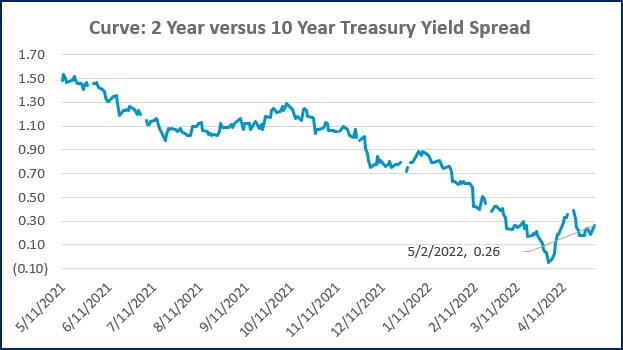
Source: Treasury.gov
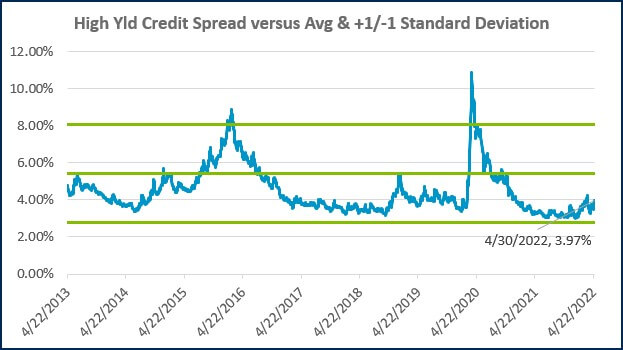
Source: FRED Database & ICE Benchmark Administration Limited (IBA)
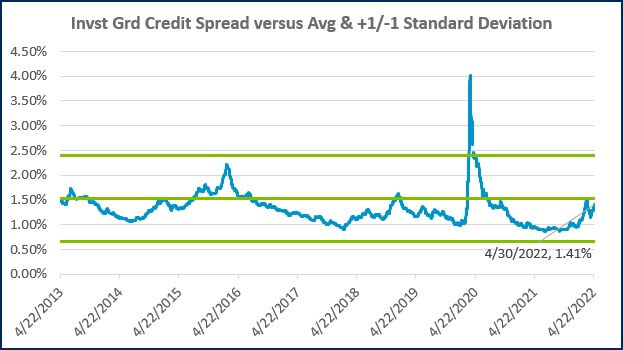
Source: FRED Database & ICE Benchmark Administration Limited (IBA)

- Competition, Achiever, Relator, Analytical, Ideation
Josh Jenkins, CFA
Josh Jenkins, Chief Investment Officer, began his career in 2010. With a background in investment analysis and portfolio management from his previous roles, he quickly advanced to his current leadership position. As a member of the Lutz Financial Board and Chair of the Investment Committee, he guides Lutz Financial’s investment strategy and helps to manage day-to-day operations.
Leading the investment team, Josh directs research initiatives, while overseeing asset allocation, fund selection, portfolio management, and trading. He authors the weekly Financial Market Update, providing clients with timely insights on market conditions and economic trends. Josh values the analytical nature of his work and the opportunity to collaborate with talented colleagues while continuously expanding his knowledge of the financial markets.
At Lutz, Josh exemplifies the firm’s commitment to maintaining discipline and helping clients navigate market uncertainties with confidence. While staying true to the systematic investment process, he works to keep clients' long-term financial goals at the center of his decision-making.
Josh lives in Omaha, NE. Outside the office, he likes to stay active, travel, and play golf.
Recent News & Insights

QuickBooks Online Checklist

What You Need to Know About the IRS’s CP53E Notices

Data-Driven Inventory Management: Using Power BI to Optimize Cash Flow & Financing

Duren & Martinson Named Forbes 2026 Best‑in‑State CPAs

