%20(1).jpg?width=264&height=160&name=Website%20Featured%20Content%20Images%20(2)%20(1).jpg)
%20(1).jpg?width=300&height=175&name=Mega%20Menu%20Image%20(2)%20(1).jpg)
%20(1)-Mar-08-2024-09-27-14-7268-PM.jpg?width=300&height=175&name=Untitled%20design%20(6)%20(1)-Mar-08-2024-09-27-14-7268-PM.jpg)

%20(1)-1.jpg?width=264&height=160&name=Website%20Featured%20Content%20Images%20(2)%20(1)-1.jpg)
-1.jpg?width=264&height=160&name=Website%20Featured%20Content%20Images%20(1)-1.jpg)
%20(1).jpg?width=264&height=160&name=Website%20Featured%20Content%20Images%20(3)%20(1).jpg)
%20(1).jpg?width=264&height=160&name=Website%20Featured%20Content%20Images%20(4)%20(1).jpg)
-Mar-08-2024-08-50-35-9527-PM.png?width=300&height=175&name=Untitled%20design%20(1)-Mar-08-2024-08-50-35-9527-PM.png)


.jpg)


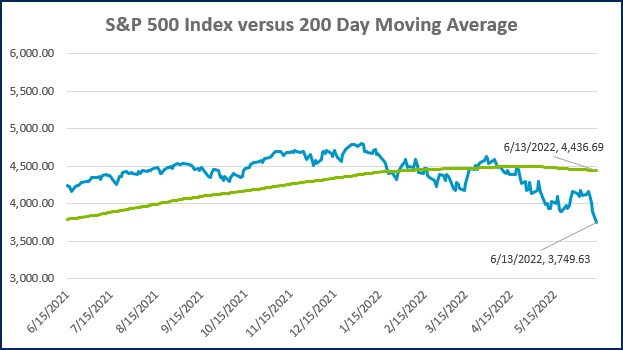
The selloff in the stock market on Monday generated considerable headlines. The S&P 500 Index closed -3.88% lower on the day, marking the 5th time this year the index has seen an intraday decline of more than 3% and ranks as the second-largest since 2020. Virtually every financial media outlet ran a story highlighting the fact that the stock market had entered a ‘Bear Market.’ What exactly does this mean? And what implication does it have for investors?
A widely promulgated definition of a bear market equates to a decline of 20% or more from a prior high. A flip side to that coin would be a ‘Bull Market,’ which is generally defined as a 20% or more gain from a prior low. Proclaiming the market has entered a bull or bear market makes an excellent headline for someone in the business of attracting eyeballs. For everybody else, the criterion is arbitrary and essentially meaningless. Fundamentally, there is no material difference between stocks falling 19.9% and 20.1% from prior highs.
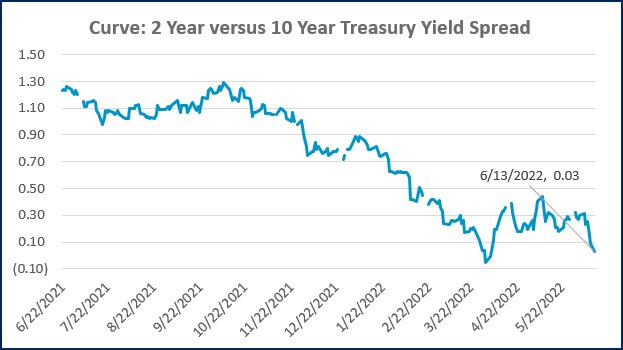
Before we get to the implications for investors, let’s look at how we got to this point. Both the stock and bond markets have been under pressure this year as the Federal Reserve (the Fed) attempts to combat the highest inflation rate in decades. To do this, they have primarily been increasing interest rates. While interest rates remain low by historical standards, as they rise, they will begin to apply braking pressure on the economy. The Fed is trying to walk a fine line between slowing the economy enough to dampen demand and tightening so much that they push the economy into a recession.
Unfortunately, changes to monetary policy bleed into the real economy with a long and variable lag, making it virtually impossible for the Fed to know in real-time if they are doing too much or too little. Further increasing the difficulty is the fact that not all sources of inflation will respond to monetary policy. The war in Ukraine and Covid lockdowns in China are causing supply chain disruptions that will exist regardless of any action taken by the Fed.
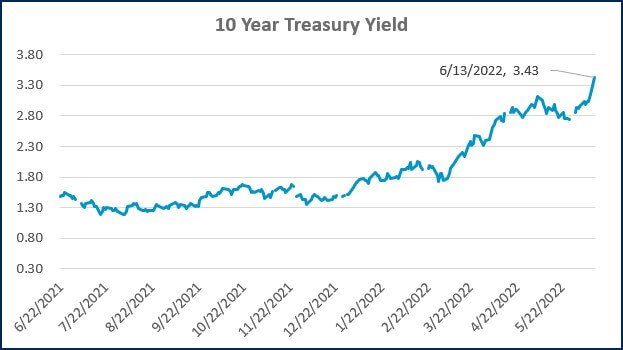
There was a growing narrative in the market that inflation may have peaked during the Spring. Data published last month seemed to validate this view, as the Consumer Price Index (CPI) saw a small decline. That narrative took a serious hit last Friday when the May CPI reading was published at a new cycle high of 8.6%. This reality check caused the bond market to price in additional rate hikes, which in turn put pressure on the stock market. The S&P 500 declined -6.8% in the two sessions following the CPI report and pushed the total fall from the previous high past the bear market threshold of -20%.
So, what are the implications of this new bear market on investors? We would argue that there are none. The short-term price fluctuation that took the loss on the S&P 500 from just under 20% to just over 20% is not meaningful to long-term investors, regardless of how much the media focused on the move.
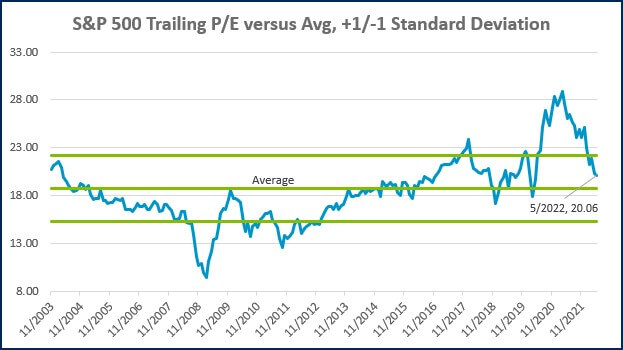
Something that IS meaningful to investors is what the recent drawdown has meant for valuations. The stock market went from being overvalued last year to fairly priced and, in some cases, even undervalued this year. As the chart below from J.P. Morgan illustrates, the price-to-earnings (P/E) ratios for parts of the U.S. stock market have fallen below the average level over the last 20 years.
Stock Market Valuations
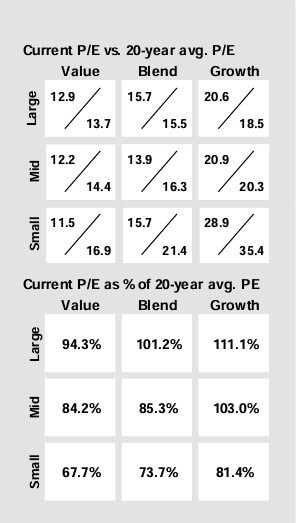
Source: J.P. Morgan Asset Management & FactSet. The price-to-earnings is a bottom-up calculation based on the most recent index price, divided by consensus estimates for earnings in the next 12 months and is provided by FactSet Market Aggregates and J.P. Morgan Asset Management. Guide to the Markets as of 6/13/2022
As a result of lower valuations, investors can pay a lower price today to participate in the earnings power of the stock market. This is particularly true for small and value-tilted companies, which are trading at a large discount to their average P/E.
Unfortunately, valuations are not a reliable tool for timing the market. Prices that seem excessively high or low can always move higher or lower, and they can remain disconnected from the fundamentals for an extended period. Still, valuations drive expected return in the long-term, even if the timing is uncertain.
Ultimately, when stock valuations become as stretched as they were last year, prices become vulnerable to a correction. This process is a normal and healthy aspect of the market. It serves to reunite prices with the underlying fundamentals, clears the market of excessive speculation and returns assets to a sustainable trajectory of appreciation.
As the chart below from Dimensional Fund Advisors (DFA) demonstrates, the stock market has historically performed quite well after a large decline. Even a decline large enough to meet the mainstream definition of a bear market has historically been followed by stronger than average returns(1).
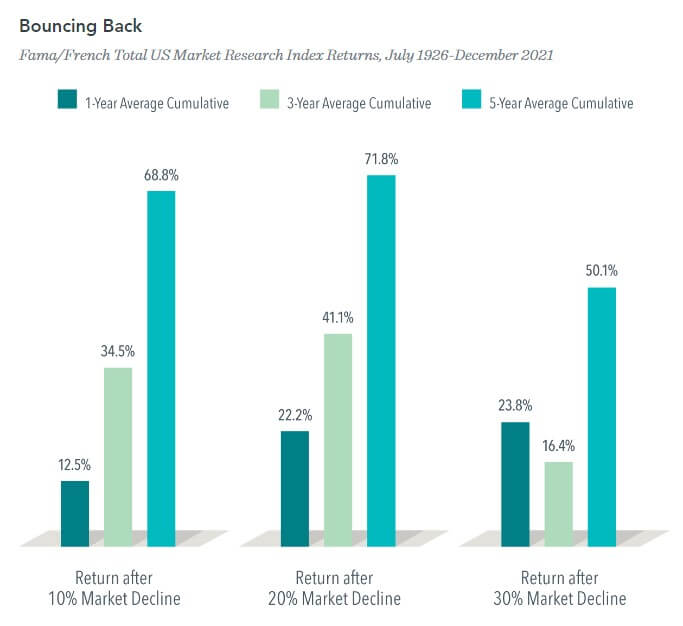
In USD. Market declines or downturns are defined as periods in which the cumulative return from a peak is –10%, –20%, or –30% or lower. Returns are calculated for the 1-, 3-, and 5-year look-ahead periods beginning the day after the respective downturn thresholds of –10%, –20%, or –30% are exceeded. The bar chart shows the average returns for the 1-, 3-, and 5-year periods following the 10%, 20%, and 30% thresholds. For the 10% threshold, there are 29 observations for 1-year look-ahead, 28 observations for 3-year look-ahead, and 27 observations for 5-year look-ahead. For the 20% threshold, there are 15 observations for 1-year look-ahead, 14 observations for 3-year look-ahead, and 13 observations for 5-year look-ahead. For the 30% threshold, there are 7 observations for 1-year look-ahead, 6 observations for 3-year look-ahead, and 6 observations for 5-year look-ahead. Peak is a new all-time high prior to a downturn. Data provided by Fama/French and available at mba.tuck.dartmouth.edu/pages/faculty/ken.french/data_library.html.
1. The long-term average return for stocks is around 10% per annum, based on the IA SBBI US Large Cap Stock TR Index
WEEK IN REVIEW
- The top story over the last week came from the Consumer Price Index (CPI) report published last Friday by the Bureau of Labor Statistics. CPI increased 1.0% in May, which was higher than the economist expectations of 0.7%, and increased by 8.6% YoY. Core CPI, which excludes the volatile food and energy components, was also higher than expected (6.0% YoY).
- Stock and bond prices have declined for three consecutive days following the release of the CPI report. The S&P 500 is down more than -7%, the yield on the 10-Year Treasury has increased to the highest level since 2011 (3.48%), and the 30-year mortgage rate increased above 6.0%.
- The Federal Reserve’s Federal Open Market Committee (FOMC) began its two-day monetary policy meeting on Tuesday, which will conclude Wednesday afternoon. The decision announcement will come at 1 PM CT and will be followed by a press conference with Chairmen Jerome Powell. At the last press conference in May, Powell indicated a likelihood for a 0.50% hike at both the June and July meetings. Following the CPI report, the bond market has begun to price in a steeper pace of rate increases, including a 0.75% hike tomorrow. In addition to the rate decision, the FOMC will publish an updated Summary of Economic Projections (SEP). Included in the SEP will be the so-called ‘Dot Plot,’ which illustrates the FOMC members median estimate for the expected path of the Federal Funds rate over the next couple of years.
HOT READS
Markets
- U.S. Inflation Hit 8.6% in May (WSJ)
- Expectations for Inflation and Spending Hit Record Levels in May, New York Fed Survey Shows (CNBC)
- 30-Year Mortgage Rate Surges to 6.28%, up from 5.5% just a week ago (CNBC)
Investing
- Once in a Lifetime (Morgan Housel)
- What Does a Normal Housing Market Look Like (Ben Carlson)
- Is Fund Management Mean to Be Sexy (TEBI)
Other
- How the Transfer Portal Leads Top Recruits to Rethink About Reclassifying (SI)
- How Lost Hikers Can Send An SOS to Space (Wired)
- Tested: 2023 Nissan Z Performance VS. 2022 Toyota GR Supra 3.0 Premium (Car and Driver)
MARKETS AT A GLANCE
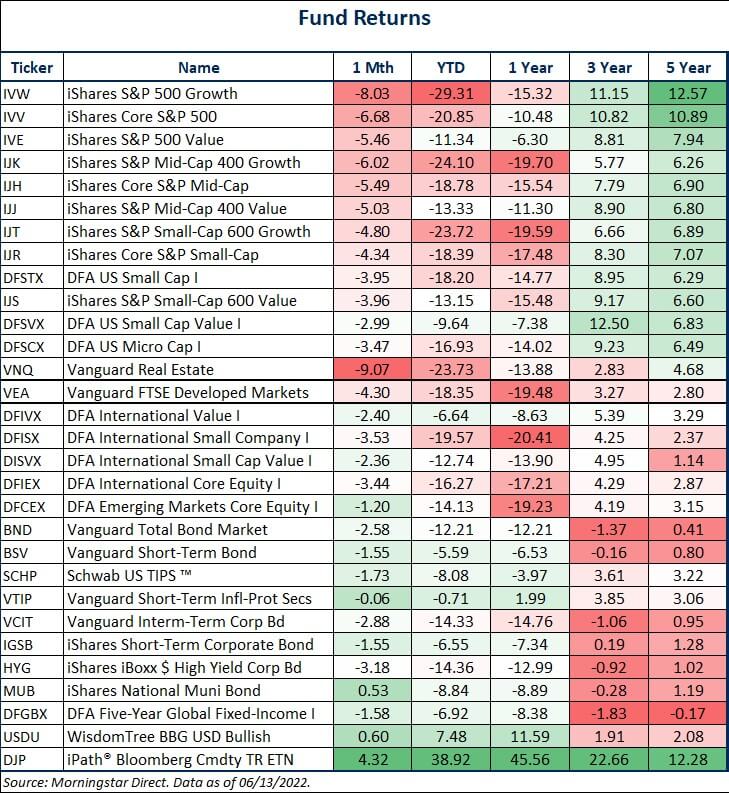
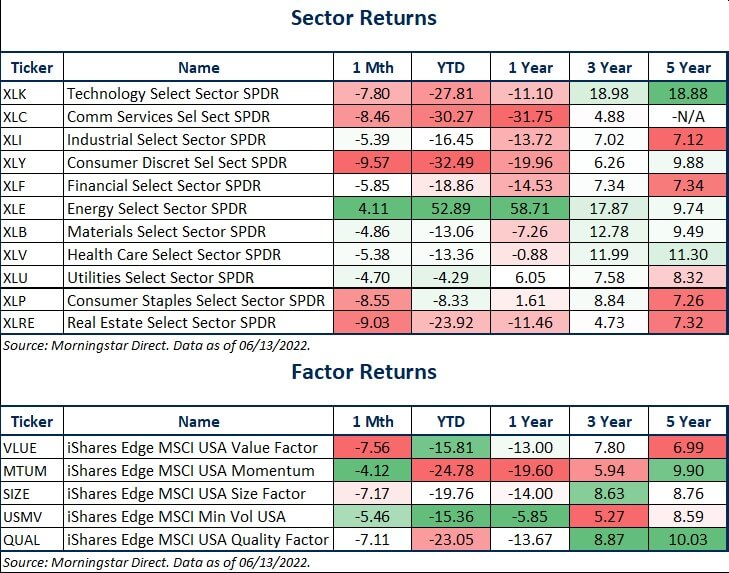
Source: Morningstar Direct.
Source: Morningstar Direct.
Source: Treasury.gov
Source: Treasury.gov
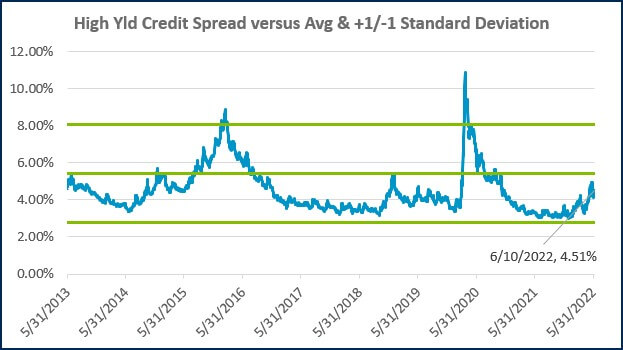
Source: FRED Database & ICE Benchmark Administration Limited (IBA)
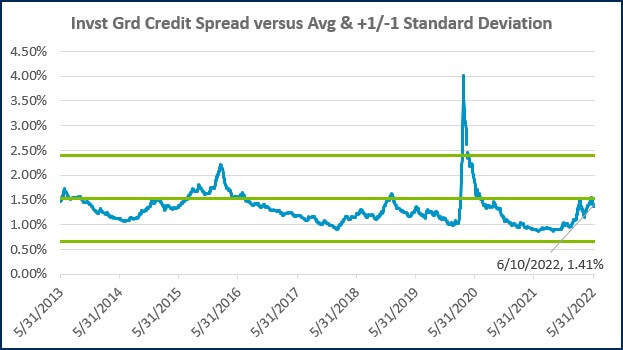
Source: FRED Database & ICE Benchmark Administration Limited (IBA)
ECONOMIC CALENDAR
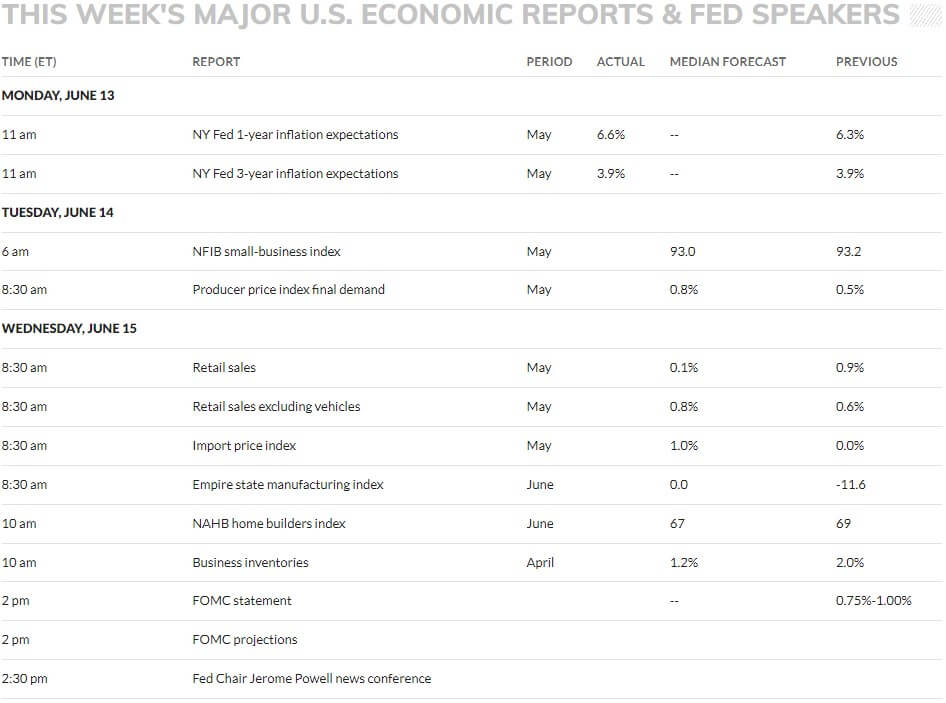
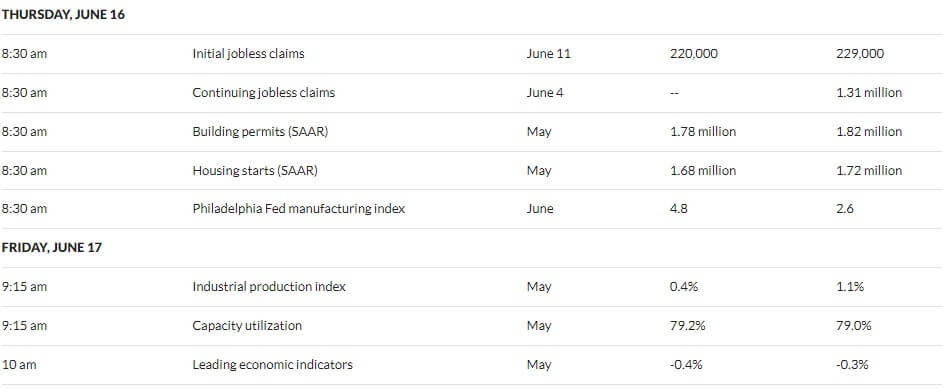
Source: MarketWatch

- Competition, Achiever, Relator, Analytical, Ideation
Josh Jenkins, CFA
Josh Jenkins, Chief Investment Officer, began his career in 2010. With a background in investment analysis and portfolio management from his previous roles, he quickly advanced to his current leadership position. As a member of the Lutz Financial Board and Chair of the Investment Committee, he guides Lutz Financial’s investment strategy and helps to manage day-to-day operations.
Leading the investment team, Josh directs research initiatives, while overseeing asset allocation, fund selection, portfolio management, and trading. He authors the weekly Financial Market Update, providing clients with timely insights on market conditions and economic trends. Josh values the analytical nature of his work and the opportunity to collaborate with talented colleagues while continuously expanding his knowledge of the financial markets.
At Lutz, Josh exemplifies the firm’s commitment to maintaining discipline and helping clients navigate market uncertainties with confidence. While staying true to the systematic investment process, he works to keep clients' long-term financial goals at the center of his decision-making.
Josh lives in Omaha, NE. Outside the office, he likes to stay active, travel, and play golf.
Recent News & Insights

QuickBooks Online Checklist

What You Need to Know About the IRS’s CP53E Notices

Data-Driven Inventory Management: Using Power BI to Optimize Cash Flow & Financing

Duren & Martinson Named Forbes 2026 Best‑in‑State CPAs

