%20(1).jpg?width=264&height=160&name=Website%20Featured%20Content%20Images%20(2)%20(1).jpg)
%20(1).jpg?width=300&height=175&name=Mega%20Menu%20Image%20(2)%20(1).jpg)
%20(1)-Mar-08-2024-09-27-14-7268-PM.jpg?width=300&height=175&name=Untitled%20design%20(6)%20(1)-Mar-08-2024-09-27-14-7268-PM.jpg)

%20(1)-1.jpg?width=264&height=160&name=Website%20Featured%20Content%20Images%20(2)%20(1)-1.jpg)
-1.jpg?width=264&height=160&name=Website%20Featured%20Content%20Images%20(1)-1.jpg)
%20(1).jpg?width=264&height=160&name=Website%20Featured%20Content%20Images%20(3)%20(1).jpg)
%20(1).jpg?width=264&height=160&name=Website%20Featured%20Content%20Images%20(4)%20(1).jpg)
-Mar-08-2024-08-50-35-9527-PM.png?width=300&height=175&name=Untitled%20design%20(1)-Mar-08-2024-08-50-35-9527-PM.png)


.jpg)


_6.19.24.jpg)
Diversification is a foundational principle of investing. It’s the recognition that the future is uncertain and that it is wise to be prepared for various potential outcomes. As Elroy Dimson famously said, “Risk means more things can happen than will happen.” So, what exactly does it mean to be diversified?
Rather than being a binary choice, the degree of diversification falls along a spectrum. The chart below provides a basic illustration. At one extreme, a single stock represents a very concentrated portfolio. With all eggs in one basket, the portfolio would risk losing all its value if the lone company became distressed.

Owning a handful of stocks reduces the risk that a single company’s failure could torpedo the entire portfolio. Due to the high cost of trading a few decades ago, this was once considered ‘fully diversified.’ Back in the 1980s and early 90s, commissions on stock trades were upwards of $200 each. This made building a broadly diversified portfolio of individual stocks prohibitively expensive. This didn’t, however, stop legions of stockbrokers from cold calling people and peddling hot stocks ‘Wolf of Wall Street’ style.
Fast forward to today, and the environment looks strikingly different. Trading commissions have largely dropped to zero, and low-cost index funds have exploded in popularity. There is now an endless array of options that slice and dice the global equity market in different ways.
Owning an index fund that tracks the large-cap US stocks of the S&P 500 virtually eliminates the risk that trouble within a single company (or even several) could have a meaningfully negative impact on the portfolio. So, does that mean an S&P 500 index fund delivers sufficient diversification? Not Quite. You can think of large-cap domestic stocks as a single asset class. While this level of diversification eliminates stock-specific risk, owning just the S&P 500 leaves you undiversified from an asset class perspective. Holdings within an asset class tend to be more highly correlated with each other relative to holdings from other asset classes.
Owning a broader index such as the Russell 3000, a popular proxy for the entire US stock market, reflects an improvement. The Russell 3000 incorporates additional asset classes, such as small and medium-sized stocks that are underrepresented in the S&P 500. However, even this falls short of full diversification, as there is literally a world of stocks beyond our domestic border.
The MSCI All Country World Index is a good representation of the entire global stock market. The inclusion of stocks from other countries vastly improves diversification, as each of those markets corresponds with their own economies, currencies, and monetary policies. The correlation between stocks within one country is substantially higher than it is amongst stocks across different countries. A broad composition of these stocks can result in a substantial reduction in portfolio volatility.
The global stock market represents a fully diversified equity portfolio. Investors have an opportunity to pursue higher expected returns by tilting that global stock portfolio toward characteristics that have been shown to deliver higher returns over time. These include smaller, lower-priced (value), and highly profitable companies. From there, high-quality bonds can be incorporated into the portfolio to calibrate the appropriate amount of risk exposure. The most aggressive investors may choose to stick with an all-equity portfolio, whereas a more conservative investor may wish to invest a substantial portion of their allocation into bonds. The optimal allocation is dependent on each individual investor’s unique personality and financial situation.
Diversification would not be necessary if it were possible to predict which asset class would deliver the highest return from one period to the next. Sadly, a crystal ball for us to peer into the future does not exist. As the chart below illustrates, there is no observable pattern in returns among the various asset classes. In an uncertain world, the best we can do is to remain diversified.
Annual Returns (%): 2009-2023

Source: Dimensional Fund Advisors (DFA).
Week in Review
- Federal Reserve officials voted unanimously to leave interest rates unchanged during their meeting last Wednesday, June 12th. They also released updated economic forecasts in its Summary of Economic Projections (SEP), including the dot plot that illustrated projections of the federal funds rate. The projections revealed the median expectation of FOMC members was for one rate cut in 2024, compared to three rate cuts from the prior SEP (assuming .25% increments). The median projection for year-end 2025 also decreased from six cuts to five.
- Last week, the Bureau of Labor Statistics (BLS) provided an update on the Fed’s progress against inflation when it published the May Consumer Price Index (CPI). For the first time in nearly two years, CPI remained flat month-over-month while rising 3.3% year-over-year. Core CPI, which excludes the volatile food and energy categories, rose 0.2% month-over-month (the smallest increase in seven months) and 3.4% year-over-year.
- The S&P 500 hit its 30th record high this year, closing at 5,473.23 on June 17th. The rally in Mega-Cap tech companies continues to push the index higher.
Hot Reads
Markets
- Fed Projects Just One Cust This Year Despite Mild Inflation Report (WSJ)
- May Retail Sales Rise 0.1%, Weaker than Expected (CNBC)
- Inflation Slows in May, With Consumer Prices up 3.3% from a Year Ago (CNBC)
Investing
- Why Front-Page News Can Mislead Investors (Morningstar)
- Order Federer vs. the Stock Market (Ben Carlson)
- Quiet Compounding (Morgan Housel)
- Bryson DeChambeau Breaks Down His Controversial “3D Printed” Clubs He Won the US Open With – Pat McAfee Show (YouTube)
- James Cameron Reveals New Information About Titanic Sub Disaster – 60 Minutes Australia (YouTube)
- Best Travel Destinations in the World 2024 (YouTube)
Markets at a Glance


Source: Morningstar Direct.

Source: Morningstar Direct.

Source: Treasury.gov

Source: Treasury.gov

Source: FRED Database & ICE Benchmark Administration Limited (IBA)

Source: FRED Database & ICE Benchmark Administration Limited (IBA)
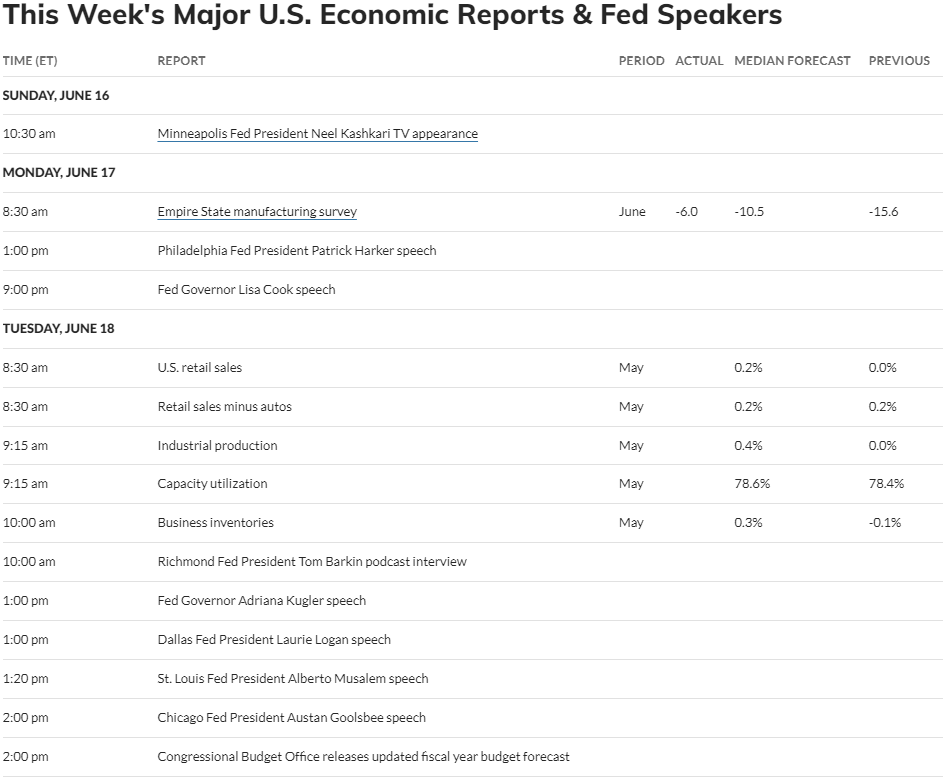
Economic Calendar


- Competition, Achiever, Relator, Analytical, Ideation
Josh Jenkins, CFA
Chief Investment Officer, Principal
Josh Jenkins, Chief Investment Officer, began his career in 2010. With a background in investment analysis and portfolio management from his previous roles, he quickly advanced to his current leadership position. As a member of the Lutz Financial Board and Chair of the Investment Committee, he guides Lutz Financial’s investment strategy and helps to manage day-to-day operations.
Leading the investment team, Josh directs research initiatives, while overseeing asset allocation, fund selection, portfolio management, and trading. He authors the weekly Financial Market Update, providing clients with timely insights on market conditions and economic trends. Josh values the analytical nature of his work and the opportunity to collaborate with talented colleagues while continuously expanding his knowledge of the financial markets.
At Lutz, Josh exemplifies the firm’s commitment to maintaining discipline and helping clients navigate market uncertainties with confidence. While staying true to the systematic investment process, he works to keep clients' long-term financial goals at the center of his decision-making.
Josh lives in Omaha, NE. Outside the office, he likes to stay active, travel, and play golf.
Recent News & Insights

Recent News
Lutz adds Experienced Director Drew Guill
Lutz, a Nebraska-based business solutions firm, recently added Drew Guill as an Audit Director ...

Recent News
Lutz Announces Redemption of Mark Duren’s Shares
Lutz, a Nebraska-based business solutions firm, announces the redemption of shares held by ...

QuickBooks
QuickBooks Online Checklist
Is QuickBooks Online right for you? QuickBooks Online can help you better manage your business ...

Accounting
What You Need to Know About the IRS’s CP53E Notices
The IRS has begun issuing CP53E Notices following a recent executive order directing federal ...


Let’s get you where you want to go.
We work to simplify complexities, help make critical business decisions, and confidently focus on the things that are truly important to you. We embrace your business as our own to spark the right solutions and help you thrive.