%20(1).jpg?width=264&height=160&name=Website%20Featured%20Content%20Images%20(2)%20(1).jpg)
%20(1).jpg?width=264&height=160&name=Website%20Featured%20Content%20Images%20(4)%20(1).jpg)
-Mar-08-2024-08-50-35-9527-PM.png?width=300&height=175&name=Untitled%20design%20(1)-Mar-08-2024-08-50-35-9527-PM.png)

%20(1)-1.jpg?width=264&height=160&name=Website%20Featured%20Content%20Images%20(2)%20(1)-1.jpg)
-1.jpg?width=264&height=160&name=Website%20Featured%20Content%20Images%20(1)-1.jpg)
%20(1).jpg?width=264&height=160&name=Website%20Featured%20Content%20Images%20(3)%20(1).jpg)


.jpg)


One of the greatest challenges faced by investors is maintaining a long-term focus. Doing this successfully means sticking to the plan regardless of what is going on in the world around you. When the market is in turmoil, it means staying invested. When speculation and excessive risk-taking are rampant, it means avoiding the fad investments that promise to make you rich quickly.
For decades, the financial media has operated a business model that monetizes attention. To grab it, they amplify the day-to-day gyrations of the market. Meaning is ascribed to every up or downtick in price, and every incoming piece of economic data is treated as some kind of main event.
Over long periods of time, the stock market will reflect the changing fundamentals of the economy and the businesses that operate within. The day-to-day shifts in price, however, are largely random. This doesn’t mean there is never an observable catalyst for an intraday move, but even those situations are often followed by shifting interpretations or new and contradictory data. The cartoon(1) below seems silly, but it’s surprisingly reflective of reality.
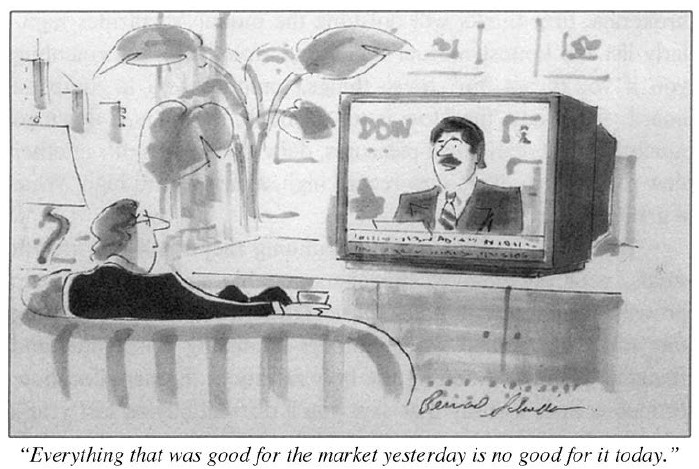
Below is another story that touches on the randomness of market moves. Nearly 100 years ago, Laurence Sloan wrote a book that I’m quite sure nobody has ever heard of. Within the book, however, is an anecdote that is often referenced in investment literature. It pertains to John Pierpont Morgan, who founded J.P. Morgan, the largest bank in the country.
History has it that an alert young man once found himself in the immediate presence of the late Mr. J. P. Morgan. Seeking to improve the golden moment, he ventured to inquire Mr. Morgan’s opinion as to the future course of the stock market. The alleged reply has become classic: “Young man, I believe the market is going to fluctuate (2).”
Morgan, who is one of history’s most influential figures in American business, understood well the importance of not getting distracted by short-term noise.
The chart below puts the power of focusing on the long-term rather than short-term fluctuations into context. It illustrates one and 30-year returns for U.S. stocks going back to the 1950s. What stands out to me are the dramatic gyrations in the 1-year return data with no clear pattern. While stocks have averaged a roughly 10% annual return over the period, the year-to-year return ranged from -37.0% to +43.4%!
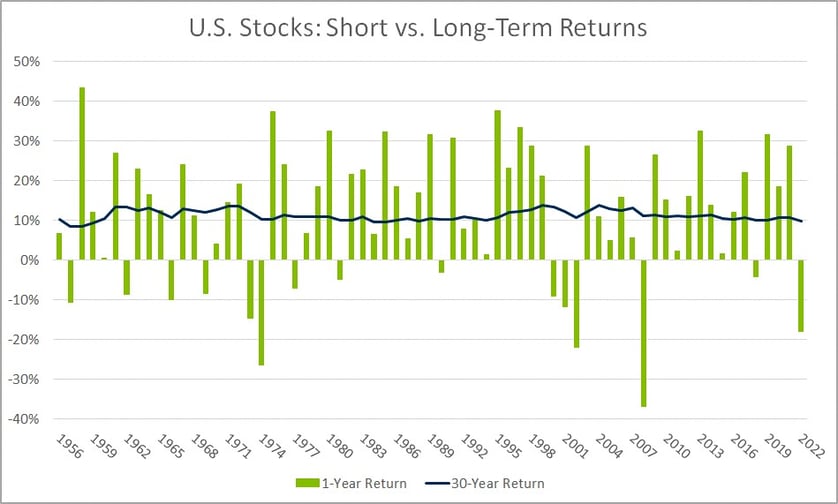
Source: Morningstar Direct. U.S. stocks represented by the IA SBBI Large Cap TR USD Index. Data from Jan 1927 to Dec 1922. All returns are annualized.
The 30-year return line, which we will interpret as long-term investment results, tells the exact opposite story. Over the long term, the stock market has delivered a remarkably stable outcome. The rolling 30-year annualized return between 1956 and 2022 ranged from 8.5% to 13.7%.
Think about it this way, if you picked the absolute worst year to begin investing over the past century, you would have still earned a positive 8.5% annualized return. Even with the worst luck, it would have resulted in a return just below the long-term average. An initial investment of $100,000 earning that 8.5% over a 30-year period would grow to more than $1.1 million. An 11x return isn’t bad for the ‘worst luck’ scenario. Although past performance is no guarantee of future results, nearly 100 years of return history is not an unreasonable way for investors to calibrate expectations for the future.
When the market is calm, people tend to underestimate the ability of fear and greed to alter their behavior. As we discussed in a recent post: The Dangers of Market Timing, Investors that deviate from their plan and make emotional decisions risk paying a heavy price. Those that can keep their emotions in check and ignore short-term market fluctuations are well-positioned to harness the wealth-creating power of the stock market.
- Marks, Howard S. Mastering the Market Cycle: Getting the Odds On Your Side. Boston, Houghton Mifflin Harcourt, 2018.
- Sloan, Laurence Henry, 1889-. Security Speculation: the Dazzling Adventure. New York and London: Harper & brothers, 1926.
Week in Review
- According to FactSet, 84% of the S&P 500 has reported Q2 results as of last Friday (8/7). The earnings growth rate, blended between companies that have already reported with the estimates for those that have yet to report, is at -5.2% year-over-year. Expectations for the earnings growth rate at the onset of earnings season was -7.0% year-over-year. Earnings growth is the fuel that powers the long-term appreciation of the stock market. For the current rally to be sustainable, earnings will have to return to a positive growth rate.
- Last week, the Consumer Price Index (CPI) headlined the economic data releases. Year-over-year inflation increased less than expected during the period, rising to 3.2% from 3.0% the prior month. Core CPI, which strips out the volatile food and energy components, declined to 4.7% year-over-year.
- Data published this morning (8/15) showed retail sales in July were much higher than expected. Other data to be published this week includes the minutes for the July FOMC meeting and industrial production on Wednesday, followed by jobless claims and the Index of U.S. Leading Economic Indicators on Thursday.
Hot Reads
Markets
- July CPI Report Shows Inflation Gauge Rose 3.2%, Less Than Expected (CNBC)
- Wholesale Prices Rose 0.3% in July, Higher than Expected (CNBC)
- Retail Sales Increased 0.7% in July, Better Than Expected as Consumer Spending is Holding Up (CNBC)
Investing
- A Few Stories About Big Decisions (Morgan Housel)
- Do Valuations Even Matter For the Stock Market (Ben Carlson)
- Is a Market Cap Index Easy or Hard to Beat (Behavioral Investment)
Other
- 5 ‘Dream Kitchen’ Upgrades That Homeowners Tend to Regret (WSJ)
- Aftermath of a Minnesota Golf Course that Got Demolished by Baseball-Sized Hail (Golf Digest)
- John Stewart & Seinfeld Getting Coffee (YouTube)
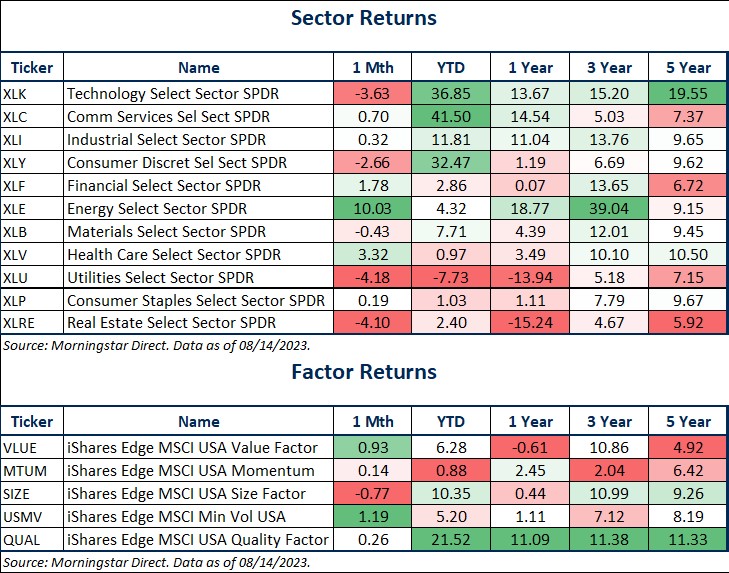
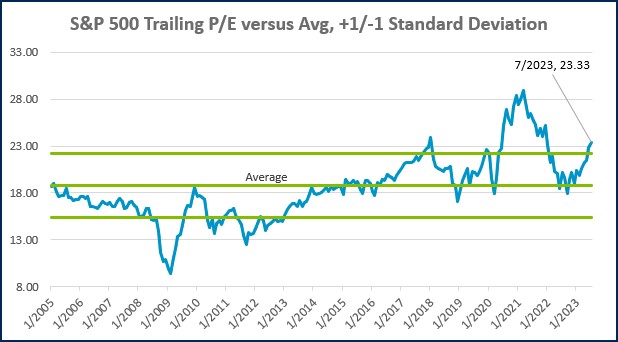
Markets at a Glance
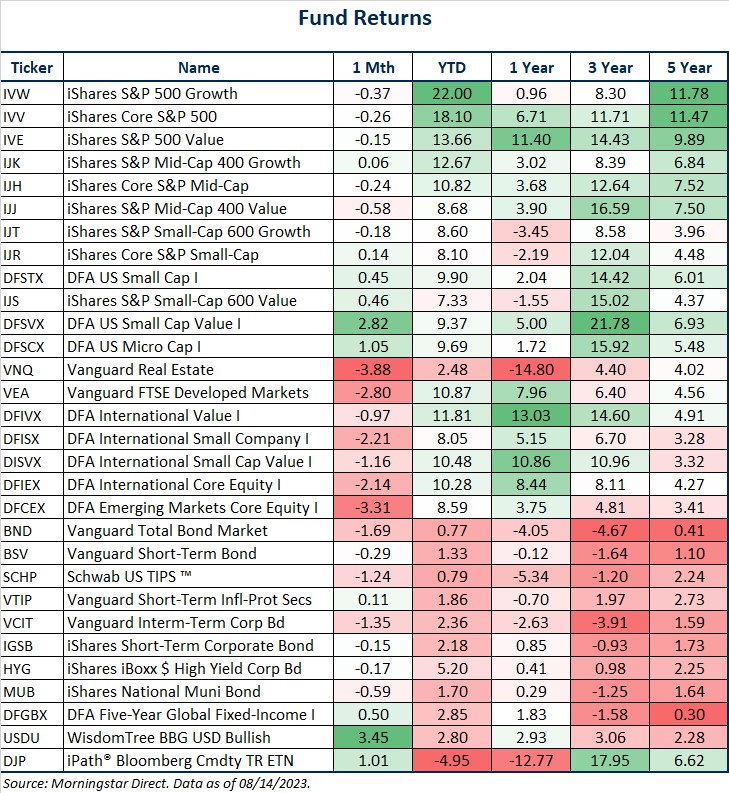

Source: Morningstar Direct.
Source: Morningstar Direct.
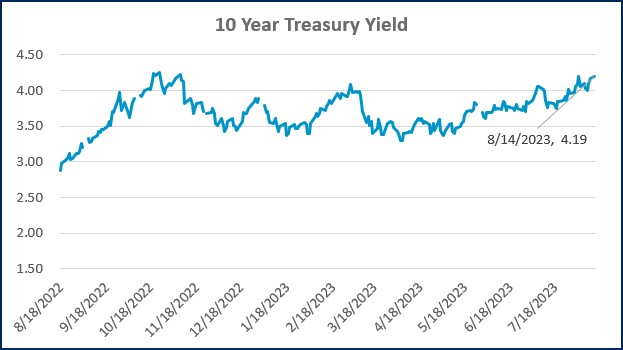
Source: Treasury.gov
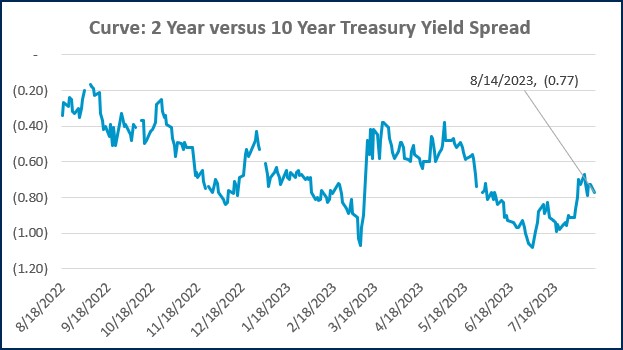
Source: Treasury.gov
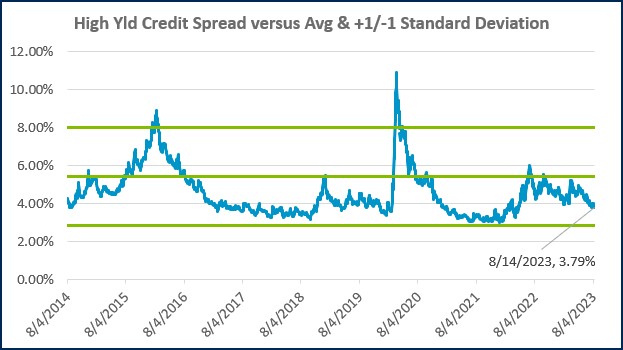
Source: FRED Database & ICE Benchmark Administration Limited (IBA)
Source: FRED Database & ICE Benchmark Administration Limited (IBA)
Economic Calendar


Source: MarketWatch

- Competition, Achiever, Relator, Analytical, Ideation
Josh Jenkins, CFA
Chief Investment Officer, Principal
Josh Jenkins, Chief Investment Officer, began his career in 2010. With a background in investment analysis and portfolio management from his previous roles, he quickly advanced to his current leadership position. As a member of the Lutz Financial Board and Chair of the Investment Committee, he guides Lutz Financial’s investment strategy and helps to manage day-to-day operations.
Leading the investment team, Josh directs research initiatives, while overseeing asset allocation, fund selection, portfolio management, and trading. He authors the weekly Financial Market Update, providing clients with timely insights on market conditions and economic trends. Josh values the analytical nature of his work and the opportunity to collaborate with talented colleagues while continuously expanding his knowledge of the financial markets.
At Lutz, Josh exemplifies the firm’s commitment to maintaining discipline and helping clients navigate market uncertainties with confidence. While staying true to the systematic investment process, he works to keep clients' long-term financial goals at the center of his decision-making.
Josh lives in Omaha, NE. Outside the office, he likes to stay active, travel, and play golf.
Recent News & Insights

Recent News
Lutz Announces 2026 Shareholder & Director Promotions
Lutz, a Nebraska-based business solutions firm, is proud to announce the promotion of 10 team ...

Nonprofit
Internal Controls for Nonprofit Organizations: Safeguarding Your Mission
Nonprofit organizations operate with a high level of accountability, ensuring every dollar ...

Job Seeker
Career Pivots: How to Identify What Matters Most
Most people don’t follow a perfectly straight career path. Outside of highly specialized ...

Accounting
Trump Accounts: What Families Need to Know
A new savings and investment program called Trump Accounts launched on July 4, 2026, creating ...


Let’s get you where you want to go.
We work to simplify complexities, help make critical business decisions, and confidently focus on the things that are truly important to you. We embrace your business as our own to spark the right solutions and help you thrive.