%20(1).jpg?width=264&height=160&name=Website%20Featured%20Content%20Images%20(2)%20(1).jpg)
%20(1).jpg?width=264&height=160&name=Website%20Featured%20Content%20Images%20(4)%20(1).jpg)
-Mar-08-2024-08-50-35-9527-PM.png?width=300&height=175&name=Untitled%20design%20(1)-Mar-08-2024-08-50-35-9527-PM.png)

%20(1)-1.jpg?width=264&height=160&name=Website%20Featured%20Content%20Images%20(2)%20(1)-1.jpg)
-1.jpg?width=264&height=160&name=Website%20Featured%20Content%20Images%20(1)-1.jpg)
%20(1).jpg?width=264&height=160&name=Website%20Featured%20Content%20Images%20(3)%20(1).jpg)


.jpg)


Last week, the Republican party held its first debate in the presidential primary race. As the election season heats up, many investors will naturally begin to wonder how the outcome might impact their investments. Specifically, what happens if the desired candidate fails in their bid for office? Is there any historical evidence that suggests it's wise for an investor to cast a vote with their wallet in addition to their ballot?
While the actions of a sitting US President can certainly impact the stock market, it is far from the only variable that might influence prices. It’s likely not even one of the most prominent ones at any given point in time. Inflation, monetary policy, the regular ebb and flow of the economy, trends in corporate profits, the rate of technological advance, the actions of foreign governments, and other exogenous shocks (such as the pandemic) can all exert a tremendous force on the markets.
The chart below from Dimensional Fund Advisors (DFA) helps us visualize the impact that various political parties have had on stocks. It illustrates how $1 invested in the large-cap stocks of the S&P 500 nearly 100 years ago would have grown over time. Periods where the White House was controlled by the Republican party are highlighted red, while Democratic control is highlighted blue. As you can see, there is no clear indication that one party has had an advantage over the other in terms of stock market performance. In fact, the only clear pattern has been the steady march higher regardless of who was in power.

Source: Dimensional Fund Advisors (DFA. In USD. Growth of wealth shows the growth of a hypothetical investment of $1 in the securities in the S&P 500 index. S&P data © 2023 S&P Dow Jones Indices LLC, a division of S&P Global. All rights reserved. Data presented in the growth of wealth chart is hypothetical and assumes reinvestment of income and no transaction costs or taxes. The chart is for illustrative purposes only and is not indicative of any investment.
The table below illustrates a similar story. Here, we can observe the actual returns for a balanced portfolio of 60% stocks and 40% bonds going back to the beginning of Franklin D. Roosevelt’s presidency. Over that nearly 100-year period, the 60/40 portfolio had an average return of 9.3%/year. While the Democrats have a slight return advantage over the entire period, both parties are very close to the long-term average. Given the relatively small sample size of just 15 Presidents, I would expect the return for each party to move closer to the long-term average over time.
Annualized Returns for a Balanced 60/40 Portfolio by President
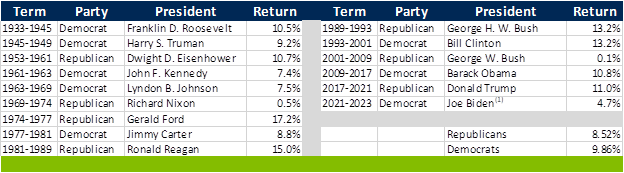
Source: Morningstar Direct. Stocks represented by the IA SBBI US Large Cap Index, bonds represented by the IA SBBI US Intermediate-Term Government Bond Index. Returns are annualized, based on monthly data. The starting period for each presidential term began the first full month after inauguration and extended through the entire month where the next president was inaugurated. (1) 2023 return represents year-to-date through July 31st.
Congress represents another avenue for the government to influence the stock market. As with the White House, however, there is little historical evidence to suggest that the party in control of Congress has a meaningful impact on stocks. An additional chart provided by DFA allows us to visualize stock market performance based on which party was in control of the House and Senate or if control was mixed. Again, there is no observable pattern that would suggest one party has had a historical advantage over the other.
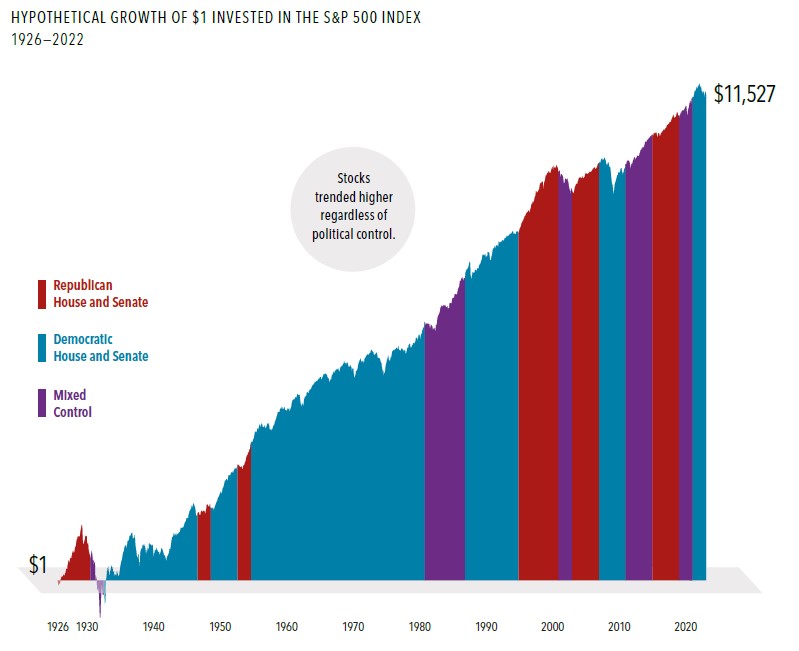
Source: Dimensional Fund Advisors (DFA. In USD. Growth of wealth shows the growth of a hypothetical investment of $1 in the securities in the S&P 500 index. S&P data © 2023 S&P Dow Jones Indices LLC, a division of S&P Global. All rights reserved. Data presented in the growth of wealth chart is hypothetical and assumes reinvestment of income and no transaction costs or taxes. The chart is for illustrative purposes only and is not indicative of any investment.
At the end of the day, business owners seek to grow their operations and efficiently serve their customers, regardless of which party is in power. While government policy can and will have an impact on business activity over time, American entrepreneurs have proven time and again their ability to adapt to an ever-changing environment.
History shows us that investors are best served by separating their politics from their portfolios. Use your ballot to cast your vote. Rely on the ingenuity of American business to adapt to the changing political landscape and provide an engine for wealth creation.
Week in Review
- Last week, Federal Reserve Chairman Jerome Powell spoke at the Kansas City Fed’s annual Economic Symposium in Jackson Hole, Wyoming. In a widely anticipated speech, Powell indicated the central bank could ‘proceed carefully,’ implying a likely pause in rate hikes at the September meeting, with the potential for additional hikes at subsequent meetings subject to how incoming economic data evolves.
- Economic data this week will be headlined by the Personal Consumption Expenditures (PCE) index on Thursday and the August payrolls report on Friday. Inflation and labor market data are being closely watched by the Federal Reserve as they assess the future path of monetary policy.
- At the start of the week, the bond market was pricing in a pause in September, followed by a 0.25% hike in November as the most likely outcome.
Hot Reads
Markets
- Why Central Bankers Are Unsure Whether They’ve Raised Rates Enough (WSJ)
- Fed Chair Powell Calls Inflation ‘Too High’ and Warns That ‘We Are Prepared to Raise Rates Further’ (CNBC)
- China’s Deflation Could Spill Over Into A Global Concern, Economists Say (CNBC)
Investing
- The Luckiest Generation (Ben Carlson)
- Cash and Bonds Are Different Investments (Monevator)
- Intelligent vs. Smart (Morgan Housel)
Other
- Con Artists Using AI, Apps to Target Parents, Grandparents for Theft – 60 Minutes (YouTube)
- The Global Race to Water at the Moon’s South Pole (WSJ)
- The PGA Tour Season is Over. Now What? Top Players Explain How They Intend to Navigate the New Fall Series (Golf Digest)
Markets at a Glance
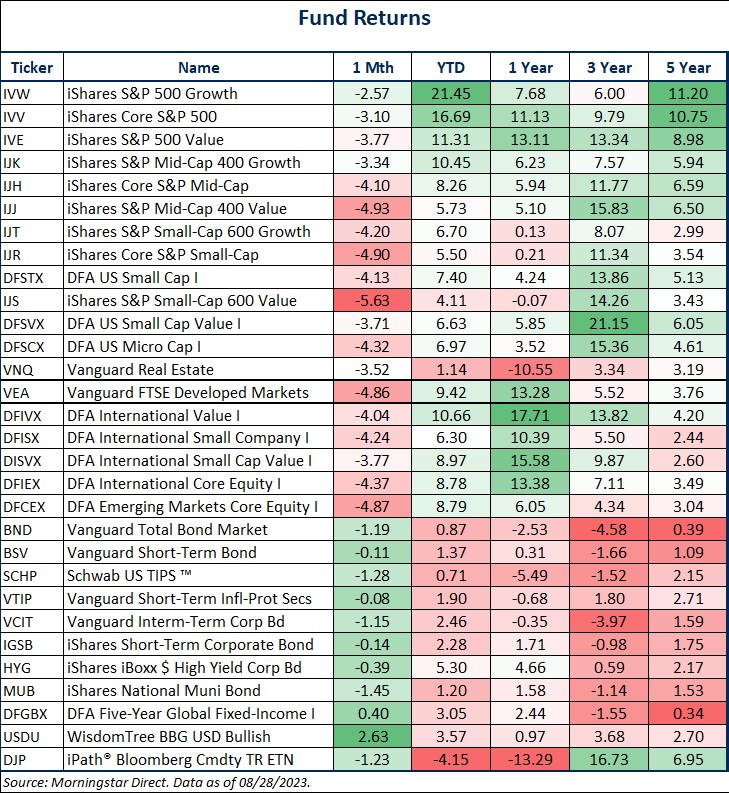
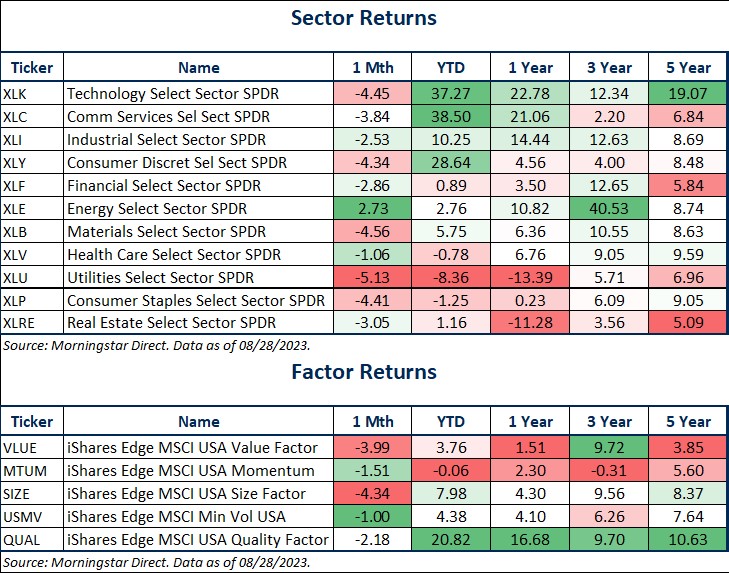
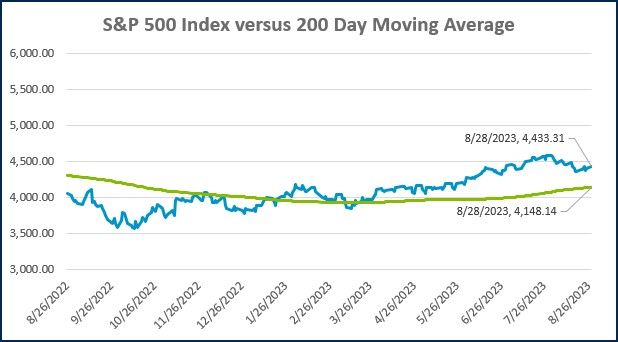
Source: Morningstar Direct.
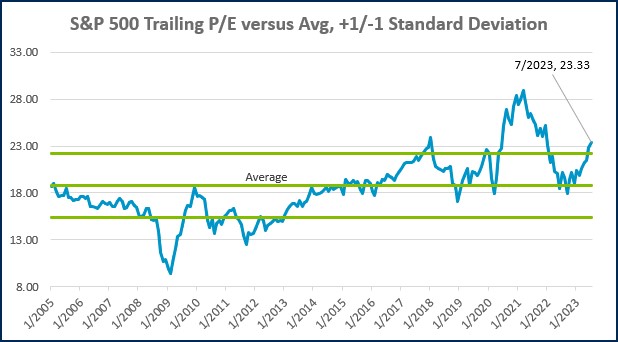
Source: Morningstar Direct.
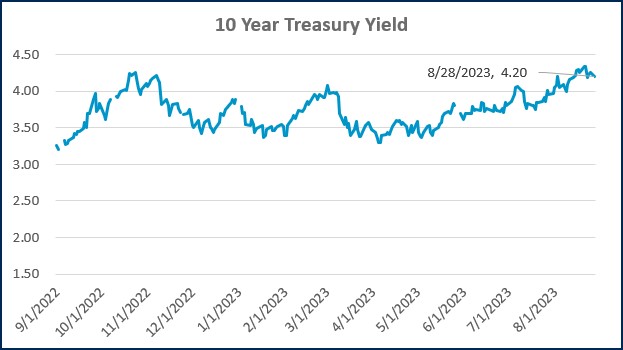
Source: Treasury.gov
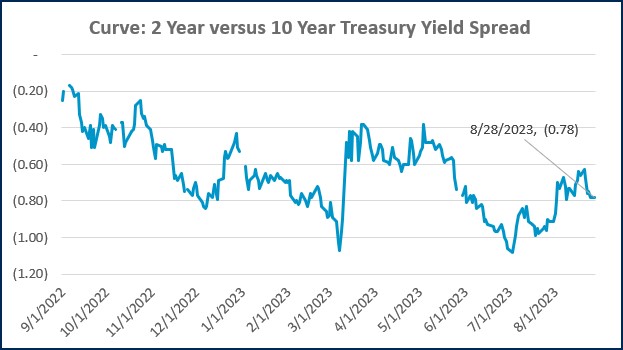
Source: Treasury.gov
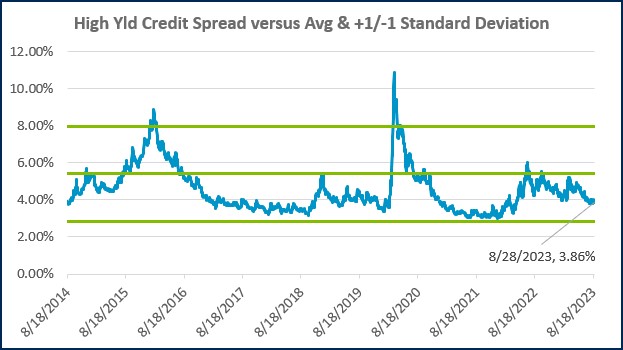
Source: FRED Database & ICE Benchmark Administration Limited (IBA)
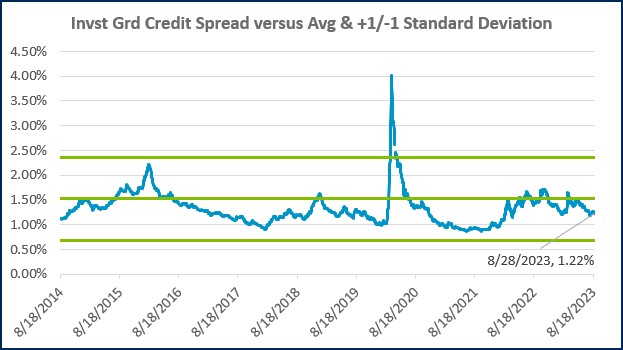
Source: FRED Database & ICE Benchmark Administration Limited (IBA)
Economic Calendar
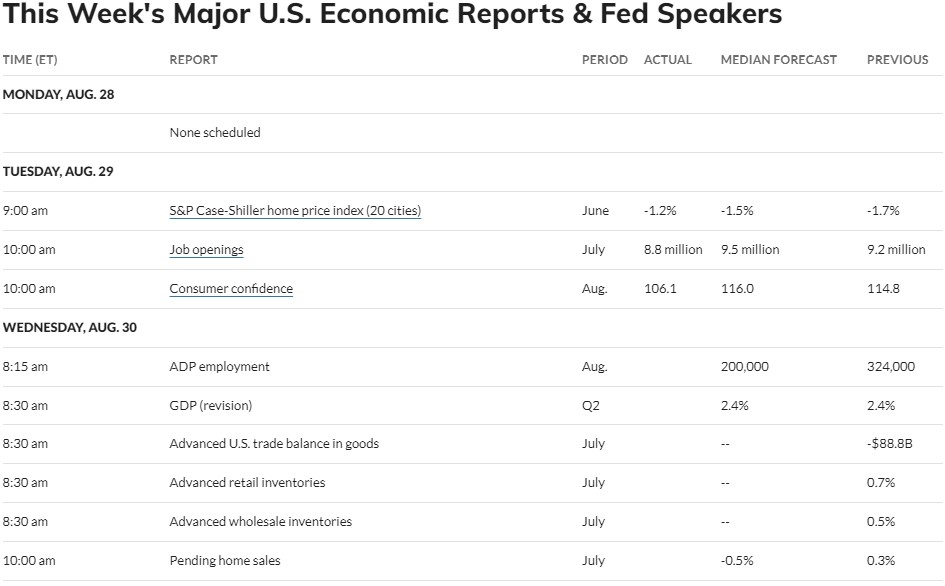
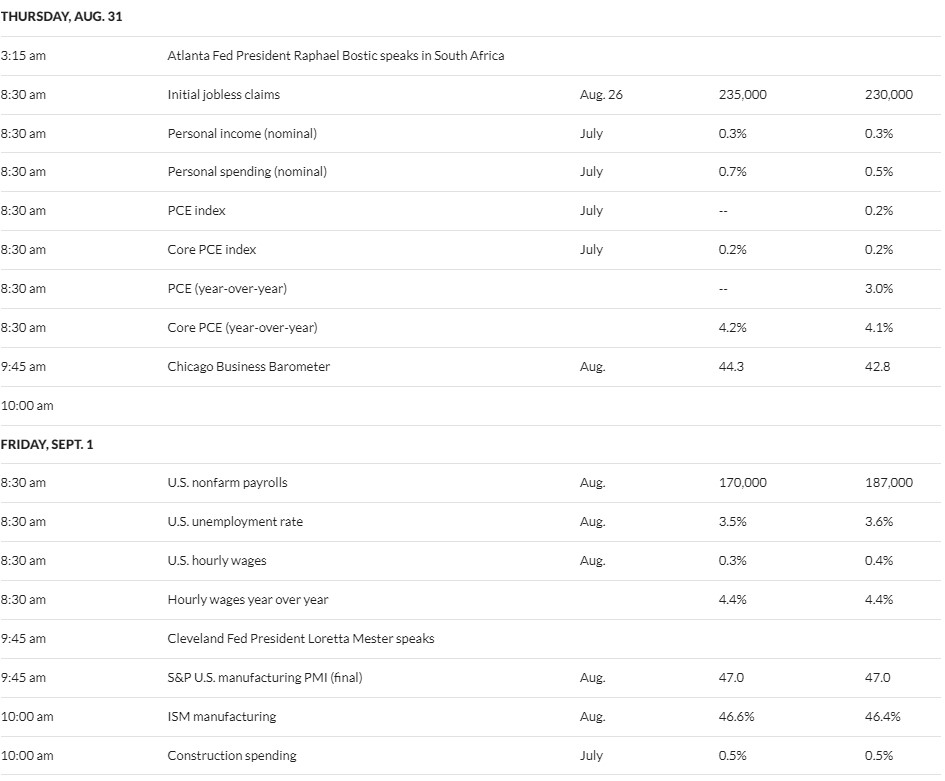
Source: MarketWatch

- Competition, Achiever, Relator, Analytical, Ideation
Josh Jenkins, CFA
Chief Investment Officer, Principal
Josh Jenkins, Chief Investment Officer, began his career in 2010. With a background in investment analysis and portfolio management from his previous roles, he quickly advanced to his current leadership position. As a member of the Lutz Financial Board and Chair of the Investment Committee, he guides Lutz Financial’s investment strategy and helps to manage day-to-day operations.
Leading the investment team, Josh directs research initiatives, while overseeing asset allocation, fund selection, portfolio management, and trading. He authors the weekly Financial Market Update, providing clients with timely insights on market conditions and economic trends. Josh values the analytical nature of his work and the opportunity to collaborate with talented colleagues while continuously expanding his knowledge of the financial markets.
At Lutz, Josh exemplifies the firm’s commitment to maintaining discipline and helping clients navigate market uncertainties with confidence. While staying true to the systematic investment process, he works to keep clients' long-term financial goals at the center of his decision-making.
Josh lives in Omaha, NE. Outside the office, he likes to stay active, travel, and play golf.
Recent News & Insights

Recent News
Lutz adds Luce, Scholting, Schmidt, and Troia
Lutz, a Nebraska-based business solutions firm, recently added Mike Luce, Gage Scholting, Ryan ...

Recent News
Benson Moul Recognized as Grand Island Top 35 Under 35 Honoree
Lutz, a Nebraska-based business solutions firm, is proud to announce that Benson Moul, Account ...

Accounting
Estate Planning Lessons from the Connelly Case: Avoiding Costly Tax
Life insurance is commonly used to fund buy-sell agreements and provide liquidity when an ...

Rural Hospital
5 Areas Rural Hospitals Should Evaluate to Improve Financial Performance
Rural hospitals continue to face mounting financial pressure. Rising labor costs, workforce ...


Let’s get you where you want to go.
We work to simplify complexities, help make critical business decisions, and confidently focus on the things that are truly important to you. We embrace your business as our own to spark the right solutions and help you thrive.