%20(1).jpg?width=264&height=160&name=Website%20Featured%20Content%20Images%20(2)%20(1).jpg)
%20(1).jpg?width=300&height=175&name=Mega%20Menu%20Image%20(2)%20(1).jpg)
%20(1)-Mar-08-2024-09-27-14-7268-PM.jpg?width=300&height=175&name=Untitled%20design%20(6)%20(1)-Mar-08-2024-09-27-14-7268-PM.jpg)

%20(1)-1.jpg?width=264&height=160&name=Website%20Featured%20Content%20Images%20(2)%20(1)-1.jpg)
-1.jpg?width=264&height=160&name=Website%20Featured%20Content%20Images%20(1)-1.jpg)
%20(1).jpg?width=264&height=160&name=Website%20Featured%20Content%20Images%20(3)%20(1).jpg)
%20(1).jpg?width=264&height=160&name=Website%20Featured%20Content%20Images%20(4)%20(1).jpg)
-Mar-08-2024-08-50-35-9527-PM.png?width=300&height=175&name=Untitled%20design%20(1)-Mar-08-2024-08-50-35-9527-PM.png)


.jpg)


One of the most reliable ways to forecast future stock market returns is to observe how stocks are being priced today. Popular valuation measures, such as the price-to-earnings (P/E) ratio, evaluate current prices relative to a fundamental measure of business performance. Valuation ratios allow an investor to assess if a stock is attractive relative to other stocks or its history.
While the use of valuation as a tool to establish return expectations is widely supported by both academics and practitioners, it’s not without limitations. In the near term, a stock’s actual return can deviate widely from what one might expect based on valuation alone. This can be observed in the chart below, which illustrates the historical relationship between price and expected return for the domestic large-cap stocks of the S&P 500 Index.
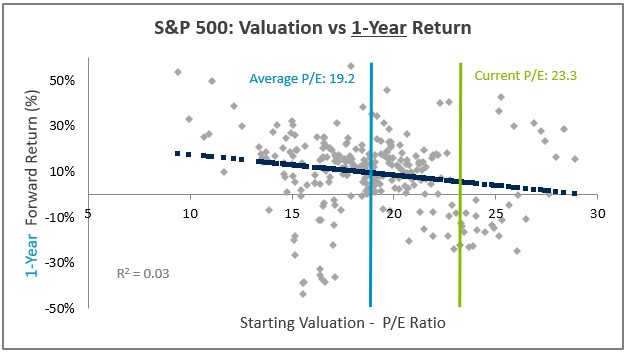
Source: Morningstar Direct. Based on the S&P 500 Index between 1/1/2000 – 7/31/2023. Valuation is based on the trailing P/E ratio. Returns are annualized.
The grey dots on the chart reflect monthly P/E ratios plotted against subsequent 1-year returns. The dark blue line represents the output of a statistical regression of those two variables and, in the presence of a strong relationship, could be used to predict future returns. However, as you can see in the chart, the relationship between the grey dots and the dark blue regression line is very weak. The large and random deviations between the two provide strong evidence that valuation does a lousy job of predicting short-term returns.
What happens if we were to extend the length of time used in the analysis? The next chart reflects the same exercise as above, using a longer 10-year return horizon. As you can see, there is an obvious inverse relationship between valuation and return, which is evidenced by the downward slope of the grey dots and dark blue regression line. The higher the valuation on the horizontal axis, the lower the return on the vertical axis. Translation: Expensive stocks have historically equated to lower returns.
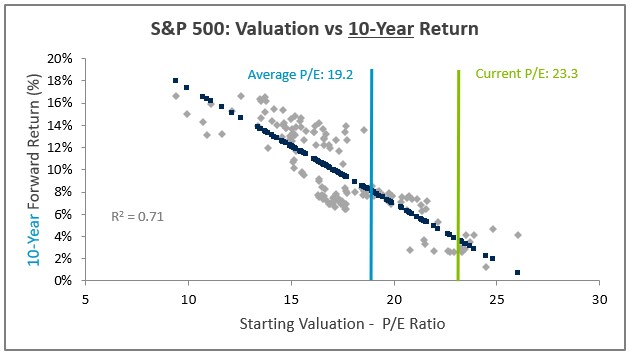
Source: Morningstar Direct. Based on the S&P 500 Index between 1/1/2000 – 7/31/2023. Valuation is based on the trailing P/E ratio. Returns are annualized.
Unfortunately for investors, stocks in the S&P 500 are expensive right now. In both charts above, there are vertical green and light blue lines that signify the current P/E ratio of 23.3 and the long-term average of 19.2. The difference between the two equates to a premium of about 21% that investors must pay relative to the long-term average.
Fortunately, other areas of the market are more attractively priced. The chart below from Avantis compares the valuation of the S&P 500 relative to the small-value stocks of the S&P 600 Value Index. Notice that:
- Small-value has a much lower P/E than large-caps today (12.7 vs 23.3)
- The historical average P/E for small-value (16.9) is lower than the historical average for large-caps (19.2)
- The spread between the P/Es of small-value and large-caps is much wider today than it has been historically. As a result, small-value is priced at a much larger than normal discount to large-caps.
P/E Ratio Comparison: Large-Caps vs. Small-Cap Value

Source: Morningstar via Avantis Investors. Data from 1/1/2000-7/31/2023.
Combine the following insights from the prior charts:
- There has historically been an inverse relationship between valuation and long-term expected return. The lower the P/E ratio, the higher the return on average.
- Small-value stocks have had a lower P/E ratio than large caps on average historically.
Based on this, you would expect that small-value stocks should have outperformed large-cap stocks historically. As the last chart below from Avantis demonstrates, that is exactly what has happened. Over a variety of measurement periods extending many decades into the past, small-value has delivered higher returns than the large-caps.
Stocks With More Attractive Valuations Have Outperformed Over the Long Term
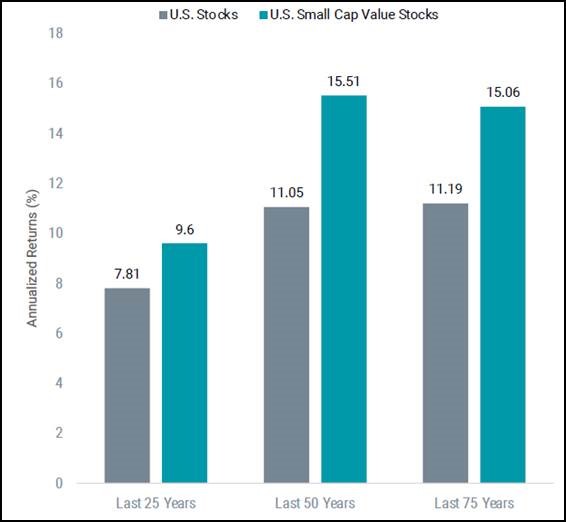
Source: Avantis Investors. Data from 7/30/1948-6/30/2023. U.S. Stocks are represented by the Market Portfolio from Ken French’s Data Library. U.S. Small Cap Value Stocks are represented by the Small Value Portfolio from Ken French’s Data Library.
Of course, it’s important to remember that this data tells us very little about what we should expect to occur in the market over the coming months. Recall that the relationship between valuation and return in the near term is weak and very noisy. Still, the signal that valuation is providing today is noteworthy for those with a long-term perspective. Small-value represents an attractive opportunity relative to richly priced large-cap stocks.
Week in Review
- The BLS released their widely followed Consumer Price Index (CPI) data this morning. The data showed that the rate of price increases in August was the fastest pace in fourteen months (3.7% YoY). An increase was expected, given the recent uptick in energy prices, but the data came in a little higher than what economists were expecting. Core CPI, which excludes the volatile food and energy components, also came higher than expected, rising 0.3% in August. On a YoY basis, Core CPI fell to 4.3% from 4.7% YoY. The Federal Reserve pays more attention to core inflation because the data is generally less noisy.
- The recent jobs report showed the economy added 187,000 jobs during August. Under normal circumstances, that would be considered a robust figure. Today, it reflects continued cooling in the labor market as the economy normalizes following the pandemic. The August figure looks relatively weak relative to the average over the last twelve months (271,000). The unemployment rate increased unexpectedly by 3.8% due to some prior month revisions and an increase in the participation rate in August.
- Other economic data to be released this week includes retail sales, the producer price index (PPI), industrial production, and consumer sentiment.
Hot Reads
Markets
- August Core Inflation, Excluding Food and Energy, Rose 0.3%, Hotter Than Expected (CNBC)
- An Important Shift in Fed Officials’ Rate Stance Is Under Way (WSJ)
- Unemployment Rate Unexpectedly Rose to 3.8% in August as Payrolls increased by 187,000 (CNBC)
Investing
- Fewer Losers, Or More Winners? (Howard Marks)
- Nobody Knows Anything, John Wick Edition (Barry Ritholtz)
- The Top Stocks of a Decade Rarely Remain On Top (Ben Carlson)
Other
- 60 Minutes: Remembering 9/11 (YouTube)
- NFL Week 1 Takeaways (SI)
- For Decades Americans Have Predicted the Downfall of a Nation: America (Scott Galloway)
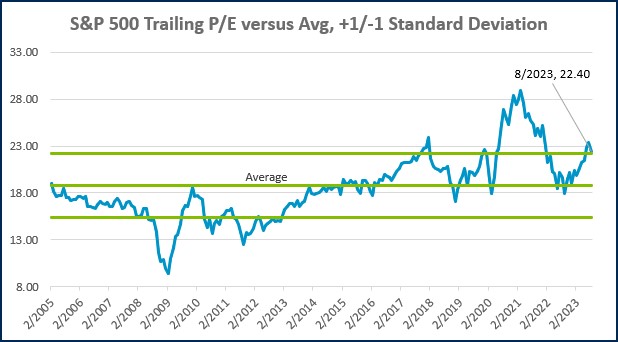
Markets at a Glance
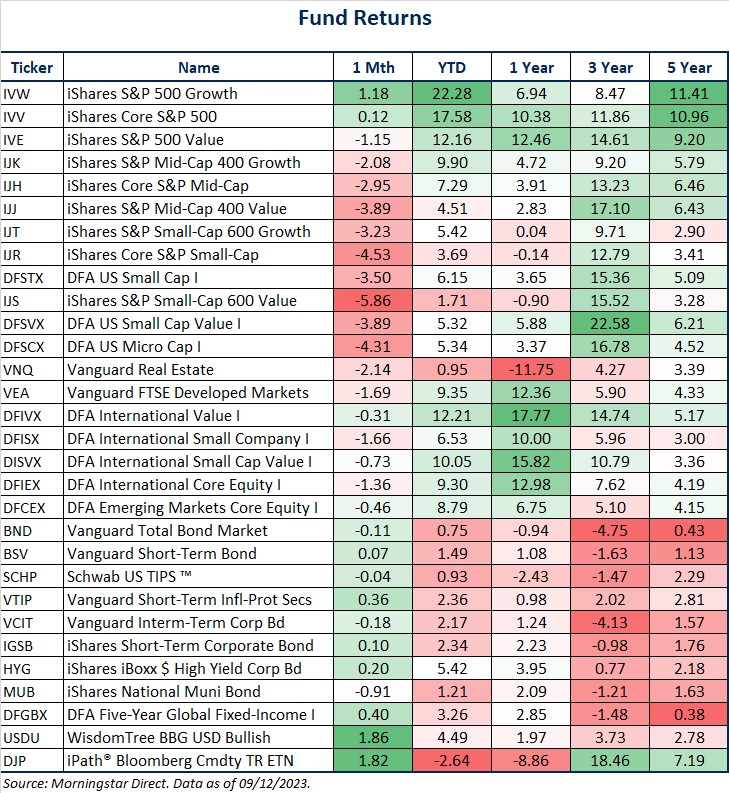
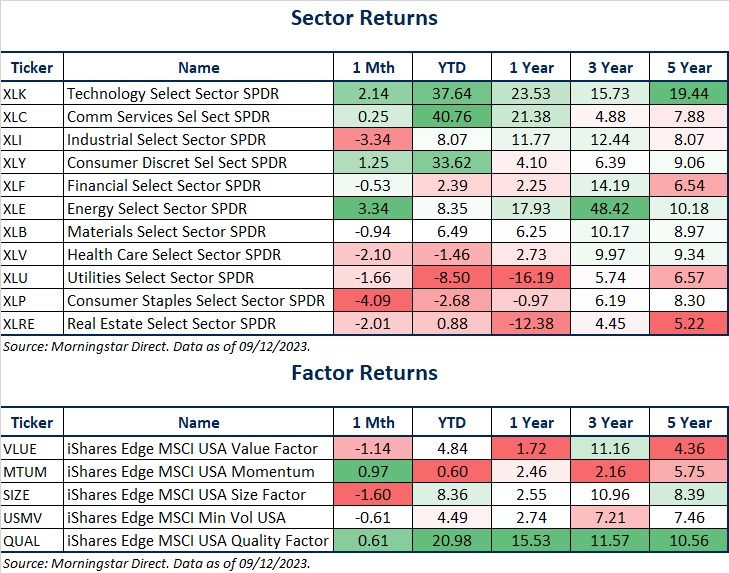
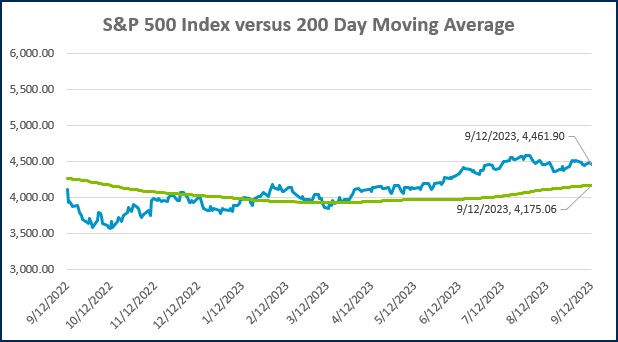
Source: Morningstar Direct.
Source: Morningstar Direct.
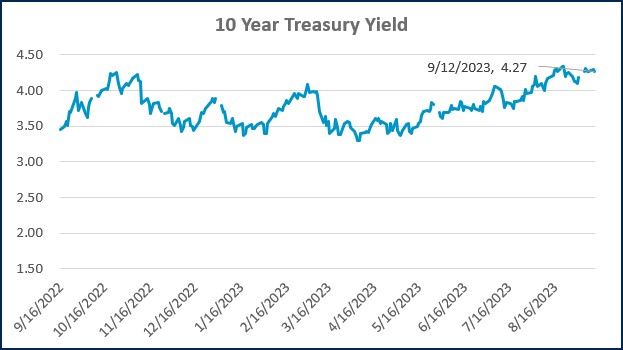
Source: Treasury.gov
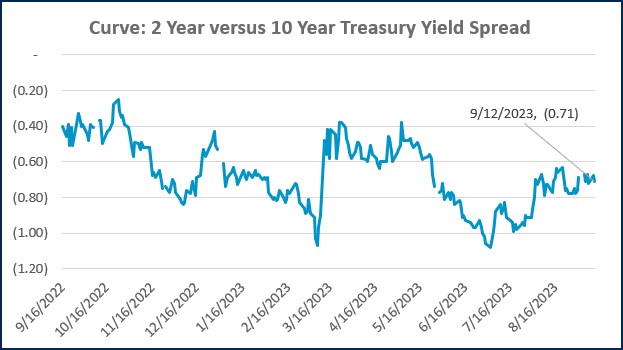
Source: Treasury.gov
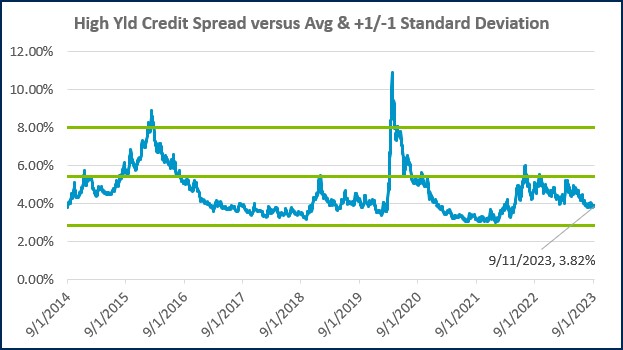
Source: FRED Database & ICE Benchmark Administration Limited (IBA)
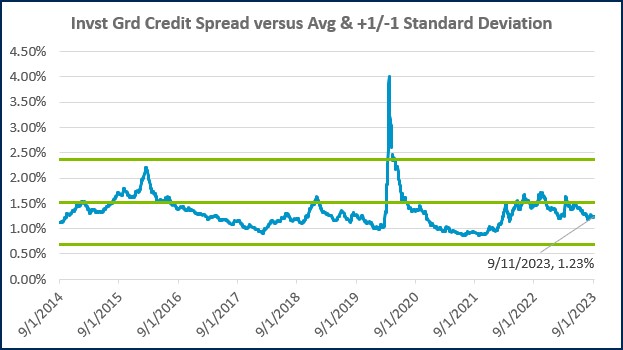
Source: FRED Database & ICE Benchmark Administration Limited (IBA)
Economic Calendar
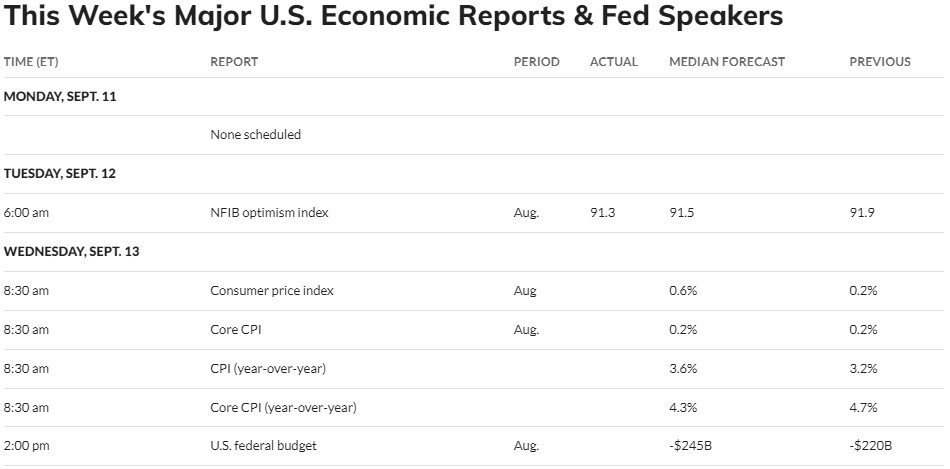
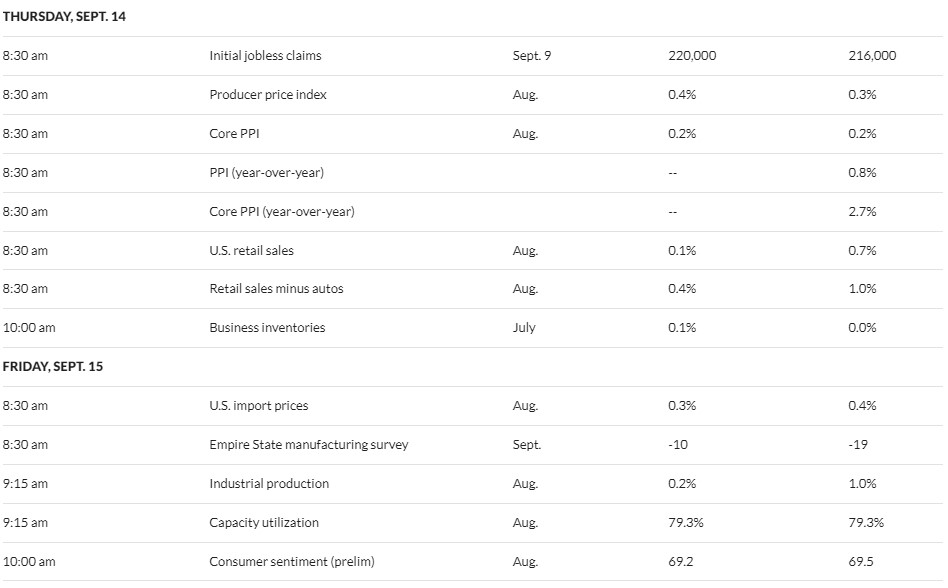
Source: MarketWatch

- Competition, Achiever, Relator, Analytical, Ideation
Josh Jenkins, CFA
Chief Investment Officer, Principal
Josh Jenkins, Chief Investment Officer, began his career in 2010. With a background in investment analysis and portfolio management from his previous roles, he quickly advanced to his current leadership position. As a member of the Lutz Financial Board and Chair of the Investment Committee, he guides Lutz Financial’s investment strategy and helps to manage day-to-day operations.
Leading the investment team, Josh directs research initiatives, while overseeing asset allocation, fund selection, portfolio management, and trading. He authors the weekly Financial Market Update, providing clients with timely insights on market conditions and economic trends. Josh values the analytical nature of his work and the opportunity to collaborate with talented colleagues while continuously expanding his knowledge of the financial markets.
At Lutz, Josh exemplifies the firm’s commitment to maintaining discipline and helping clients navigate market uncertainties with confidence. While staying true to the systematic investment process, he works to keep clients' long-term financial goals at the center of his decision-making.
Josh lives in Omaha, NE. Outside the office, he likes to stay active, travel, and play golf.
Recent News & Insights

Recent News
Lutz adds Experienced Director Drew Guill
Lutz, a Nebraska-based business solutions firm, recently added Drew Guill as an Audit Director ...

Recent News
Lutz Announces Redemption of Mark Duren’s Shares
Lutz, a Nebraska-based business solutions firm, announces the redemption of shares held by ...

QuickBooks
QuickBooks Online Checklist
Is QuickBooks Online right for you? QuickBooks Online can help you better manage your business ...

Accounting
What You Need to Know About the IRS’s CP53E Notices
The IRS has begun issuing CP53E Notices following a recent executive order directing federal ...


Let’s get you where you want to go.
We work to simplify complexities, help make critical business decisions, and confidently focus on the things that are truly important to you. We embrace your business as our own to spark the right solutions and help you thrive.