.jpg?width=300&height=175&name=Mega%20Menu%20Image%20(1).jpg)
%20(1).jpg?width=300&height=175&name=Mega%20Menu%20Image%20(2)%20(1).jpg)
%20(1)-Mar-08-2024-09-27-14-7268-PM.jpg?width=300&height=175&name=Untitled%20design%20(6)%20(1)-Mar-08-2024-09-27-14-7268-PM.jpg)

%20(1)-Mar-08-2024-09-11-30-0067-PM.jpg?width=300&height=175&name=Untitled%20design%20(3)%20(1)-Mar-08-2024-09-11-30-0067-PM.jpg)
%20(1).jpg?width=300&height=175&name=Mega%20Menu%20Image%20(3)%20(1).jpg)
%20(1).jpg?width=300&height=175&name=Mega%20Menu%20Image%20(4)%20(1).jpg)
%20(1).jpg?width=300&height=175&name=Mega%20Menu%20Image%20(5)%20(1).jpg)
-Mar-08-2024-08-50-35-9527-PM.png?width=300&height=175&name=Untitled%20design%20(1)-Mar-08-2024-08-50-35-9527-PM.png)


.jpg)


Financial ratios are a great tool for evaluating the economic health of manufacturing companies. They provide valuable insights into various aspects of a company's operations, such as liquidity, efficiency, profitability, and solvency. By analyzing these ratios, you can evaluate a business's performance and identify areas for improvement. We’ll explore how these ratios can be utilized for benchmarking purposes.
1. Liquidity Ratios
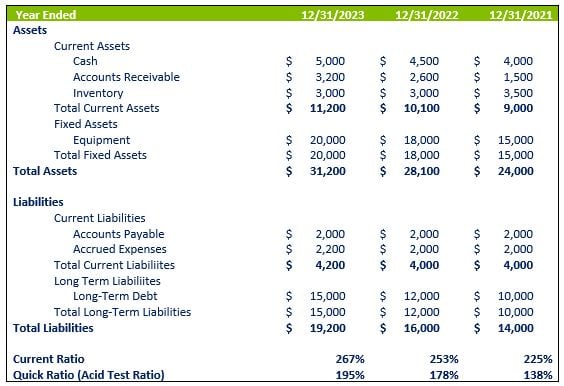
Liquidity ratios evaluate the ability to meet short-term obligations. They measure the company's capacity to quickly convert assets into cash. Two commonly used liquidity ratios in the manufacturing industry are the current ratio and quick ratio.
Current Ratio
The current ratio indicates whether a company's current assets can cover its current liabilities. A higher ratio is generally preferred, as it suggests a stronger ability to meet short-term obligations.
Current Ratio = Current Assets / Current Liabilities
Quick Ratio
The quick ratio, also known as the acid-test ratio, is a more conservative measure of liquidity. It excludes inventory from current assets, as it may not be easily convertible to cash.
Quick Ratio = (Current Assets - Inventory) / Current Liabilities
2. Efficiency Ratios
Efficiency ratios measure a business's operational efficiency and effectiveness in utilizing its assets. In manufacturing, efficiency ratios provide insights into how well a company is managing its resources and generating revenue. Two commonly used efficiency ratios are the inventory turnover ratio and asset turnover ratio.
Inventory Turnover Ratio
The inventory turnover ratio measures how quickly a company is selling and replacing its inventory. A higher ratio indicates efficient inventory management and sales.
Inventory Turnover Ratio = Cost of Goods Sold / Average Inventory
Asset Turnover Ratio
The asset turnover ratio measures how efficiently a company utilizes its total assets to generate sales. A higher ratio suggests effective asset utilization and revenue generation.
Asset Turnover Ratio = Net Sales / Average Total Assets
3. Profitability Ratios
Profitability ratios assess the ability to generate profits from operations. They provide insights into a company's profitability and ability to create a return on investment. The three types of profitability ratios are as follows:
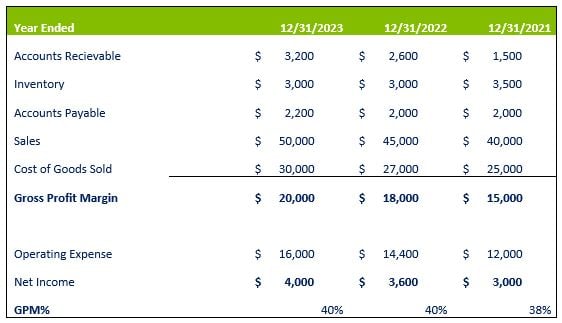
Gross Profit Margin Percentage
The gross profit margin measures the percentage of sales revenue that remains after deducting the cost of goods sold. It indicates how effectively a company manages its production costs.
Gross Profit Margin Percentage = (Net Sales - Cost of Goods Sold) / Net Sales
Operating Profit Margin
The operating profit margin measures the profitability of a company's core operations by assessing the percentage of operating income generated from sales. It shows the company's ability to generate profits from its day-to-day manufacturing activities.
Operating Profit Margin = Operating Income / Net Sales
Net Profit Margin
The net profit margin measures a company's overall profitability by calculating the percentage of net income generated from sales after deducting all expenses. It reflects the company's ability to generate profits after accounting for all costs.
Net Profit Margin = Net Income / Net Sales
4. Solvency Ratios
Solvency ratios assess a manufacturing company's long-term financial stability and ability to meet long-term debt obligations. These ratios evaluate a company's financial health and risk exposure.
Debt-to-Equity Ratio
The debt-to-equity ratio measures the proportion of debt-to-equity financing in a company's capital structure. It indicates the level of financial risk and the extent to which a company relies on debt to fund its operations.
Debt-to-Equity Ratio = Total Debt / Total Equity
Interest Coverage Ratio
The interest coverage ratio assesses a company's capability of meeting its interest payments on outstanding debt. It measures the company's earnings relative to its interest expenses, providing insights into its capacity to cover interest obligations.
Interest Coverage Ratio = Earnings Before Interest and Taxes (EBIT) / Interest Expenses
Return on Capital Employed (ROCE)
Return on Capital Employed (ROCE) is a profitability ratio that measures the return a company generates from its capital investments. It evaluates the company's ability to cover its debts and create profits for shareholders.
ROCE = Earnings Before Interest and Taxes (EBIT) / (Total Assets - Current Liabilities)
Assess Your Performance with Lutz’s Manufacturing Accounting Services
These ratios provide valuable insights into a manufacturing company's operations and help in benchmarking against industry standards. Stakeholders can use them for liquidity, efficiency, profitability, and solvency. If you’d like help evaluating your performance, Lutz offers accounting services for manufacturing businesses. If you have questions, please contact us.

- Achiever, Communication, Learner, Self-Assurance, Responsibility
Jerad Knott
Jerad Knott, Tax Shareholder, began his career in 2003. Since joining Lutz, he has held several leadership roles, including serving on the board of directors for six years, overseeing the Grand Island office, and serving as the agriculture and manufacturing niche lead.
Specializing in tax consulting and compliance, Jerad serves clients across the agribusiness, construction, healthcare, and manufacturing industries. He focuses on managing client relationships while providing comprehensive business planning solutions. Jerad values helping clients succeed and takes pride in playing a role in their achievements.
At Lutz, Jerad embodies the firm's commitment to “be humble” through his quiet yet impactful leadership style. His dedication to mentoring staff while maintaining a focus on practical solutions has strengthened Lutz's presence in central Nebraska.
Jerad lives in Doniphan, NE, with his wife Amy and their four kids. Outside the office, he enjoys shooting sporting clays, fishing, golfing, hunting, and taking annual family vacations to new destinations.
Recent News & Insights

Recruiting medical talent? Know the Tax Implications of Modern Compensation Packages

How Stay Interviews Help Retain High Performers

The Importance of Hiring an M&A Team

Treasury Management: Strategies to Improve Financial Stability & Growth

