.jpg?width=300&height=175&name=Mega%20Menu%20Image%20(1).jpg)
%20(1).jpg?width=300&height=175&name=Mega%20Menu%20Image%20(2)%20(1).jpg)
%20(1)-Mar-08-2024-09-27-14-7268-PM.jpg?width=300&height=175&name=Untitled%20design%20(6)%20(1)-Mar-08-2024-09-27-14-7268-PM.jpg)

%20(1)-Mar-08-2024-09-11-30-0067-PM.jpg?width=300&height=175&name=Untitled%20design%20(3)%20(1)-Mar-08-2024-09-11-30-0067-PM.jpg)
%20(1).jpg?width=300&height=175&name=Mega%20Menu%20Image%20(3)%20(1).jpg)
%20(1).jpg?width=300&height=175&name=Mega%20Menu%20Image%20(4)%20(1).jpg)
%20(1).jpg?width=300&height=175&name=Mega%20Menu%20Image%20(5)%20(1).jpg)
-Mar-08-2024-08-50-35-9527-PM.png?width=300&height=175&name=Untitled%20design%20(1)-Mar-08-2024-08-50-35-9527-PM.png)


.jpg)


The investment industry produces a virtually limitless supply of charts and graphs. They can illustrate everything from trends in macroeconomic variables to asset prices, sector valuations, and industry fundamentals. An investor could spend every waking second trying to consume all of this information and still fall short of learning everything the market already knows. Within this vast sea of data, there is one chart that if properly understood, could help investors avoid a critical mistake. In my opinion, it is probably the most important chart in investing.
“Investing is not a game where the guy with the 160 IQ beats the guy with the 130 IQ. Once you have ordinary intelligence, what you need is the temperament to control the urges that get other people into trouble in investing.” – Warren Buffett
Over time, the stock market is driven by business fundamentals, but in the near term, it can be driven by sentiment. Sentiment is often cyclical and is capable of pushing asset prices far from what would be considered fair value. These episodes represent periods of heightened risk for investors.
The urges that Buffett eluded to are commonplace when the cycle of investor emotion hits an extreme. During these periods, emotions can run high and begin to impact an investor’s decision-making. The cycle is illustrated below in this simple yet exceptionally powerful chart from Dimensional Fund Advisors (DFA).
The Cycle of Investor Emotion
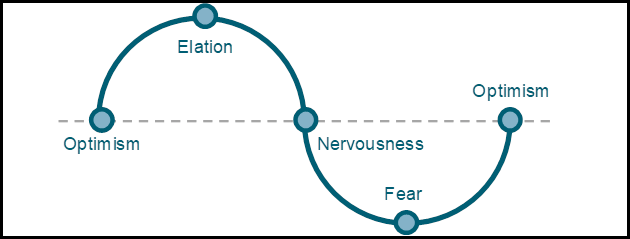
Source: Dimensional Fund Advisors
The true cycle of investor emotion is perpetual, with no true beginning or end. To illustrate the concept, DFA chose to begin and end at the ‘optimism stage.’ The various stages in the cycle can be described as:
- Optimism – The economy and business fundamentals are improving. Stock market returns are generally positive. Investor tolerance and appetite for risk are increasing.
- Elation – Generally follows an extended period of economic growth and high market returns. Investors can’t imagine a scenario where the outlook is poor. Risk tolerance is high, and there is excessive speculation.
- Nervousness – The economy and/or stock market have hit some snags. Stock market returns turn negative. Investors risk tolerance and appetite shrink.
- Fear – Economic growth has slowed and is potentially contracting. Asset prices are under significant pressure. Investors can’t imagine a scenario where the outlook improves. Risk tolerance and appetite are non-existent.
Of course, market sentiment does not move as cleanly from one stage to the next as this chart would suggest. The market’s mood ebbs and flows, and there are plenty of head-fakes throughout.
It’s a good thing you don’t need a genius IQ to have success investing because most of us don’t have that. An even-keeled temperament capable of resisting the many emotional temptations would actually be a useful tool, but many people don’t have that either.
Luckily, there is something that virtually any investor can utilize: A diversified portfolio equipped with rules-based rebalancing. By diversifying, investors can be confident that they are participating in the appreciation of the best companies when times are good while mitigating the risk associated with any single business, industry, or country when times are bad. For those investors that don’t like to sit on their hands, a well-designed rebalancing program allows them to respond to changing market conditions. By removing emotion from the equation, a rules-based approach increases the likelihood of buying low and selling high and not the other way around.
What makes this chart so critical is it illustrates the fact that there are recurring periods where the market acts on elation and fear. The really big mistakes made by investors often occur during these times, as emotions are running hottest and have the ability to override typical decision-making. This can manifest itself as capitulating to the fear of missing out (FOMO) and piling into speculative assets right before a collapse or giving into panic and liquidating worthwhile investments near a market bottom. Individuals that can resist these urges, whether through temperament or a diversified rules-based approach, are positioned to avoid the potentially costly mistakes caused by emotional decisions.
WEEK IN REVIEW
- According to Factset, 56% of the S&P 500 has reported earnings results for Q3, with 82% of these firms outperforming forecasts. Earnings for companies that have already reported, blended with the estimates for companies that have not yet reported, have grown by 36.6% YoY. This exceeds the 27.4% estimate for YoY earnings growth as of the end of September.
- Economic data published last week showed that Core PCE, the Fed’s preferred inflation gauge, increased by 3.6% over the past year. This matches the August figure as the fastest pace of inflation in the last 30 years and is well above the Fed’s 2% target. Yesterday, the Institute for Supply Management (ISM) published data showing that manufacturing activity decelerated during October as supply chains remain clogged. Later this week, there will be a host of additional economic data publications, including an update on service sector activity on Wednesday, jobless claims Thursday, and the Jobs report on Friday.
- The Federal Reserve began its two-day policy meeting today, which will conclude tomorrow at 1 PM CT with the rate announcement. Fed Chair Jerome Powell will then give his post-meeting press conference at 1:30 PM CT on Yahoo Finance. The market is expecting the Fed to announce the end of its bond purchase program. The market is not expecting a change in interest rates at this meeting. According to the CME Group, fed fund futures are currently pricing in the first-rate hike next summer, with three total (0.25%) hikes by December 2022.
ECONOMIC CALENDAR
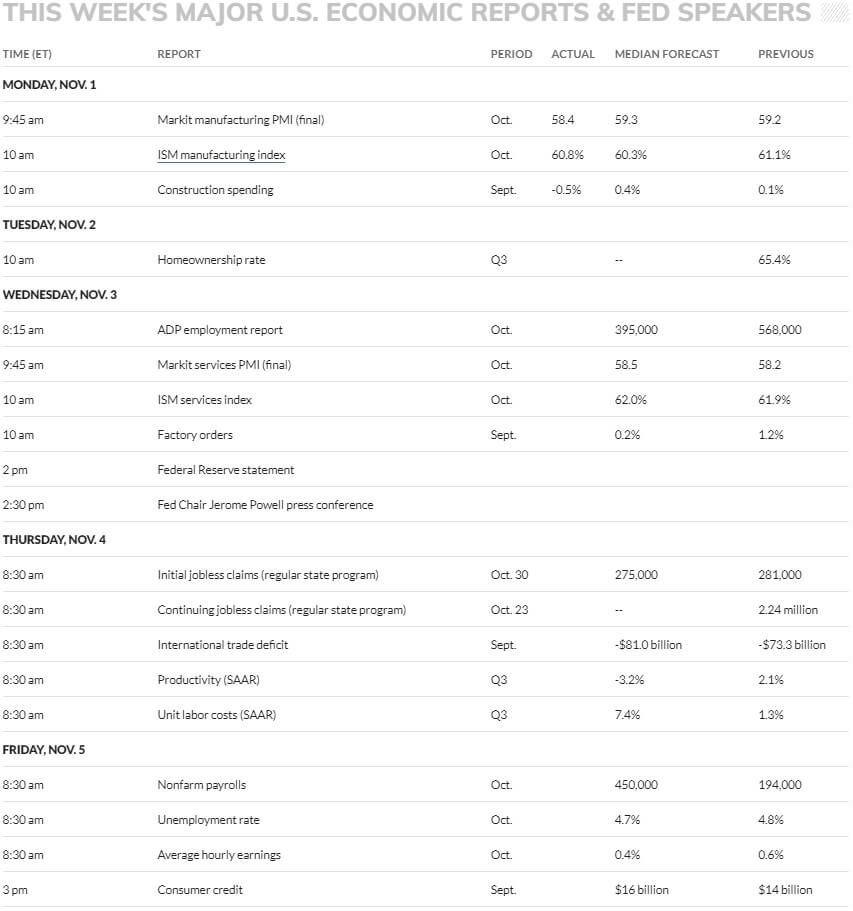
Source: MarketWatch
HOT READS
Markets
- Inflation Notches a Fresh 30-Year High As Measured by the Fed’s Favorite Gauge (CNBC)
- U.S. Manufacturing Sector Slows Moderately in October (CNBC)
- The Fed is Expected to Announce End to Bond-Buying Program as Investors Seek Clues on First Hike (CNBC)
Investing
- Deflating your Inflation Fears (Jason Zweig)
- Internal vs. External Benchmarks (Morgan Housel)
- Let the Market Worry For You (Michael Batnick)
Other
- From Heisman Hopeful to the Dark Side (SI)
- Facebook Plans to Shut Down Its Facial Recognition Program (CNBC)
- I’m a Twenty Year Truck Driver, I Will Tell You Why America’s ‘Shipping Crisis’ Will Not End (Medium)
MARKETS AT A GLANCE
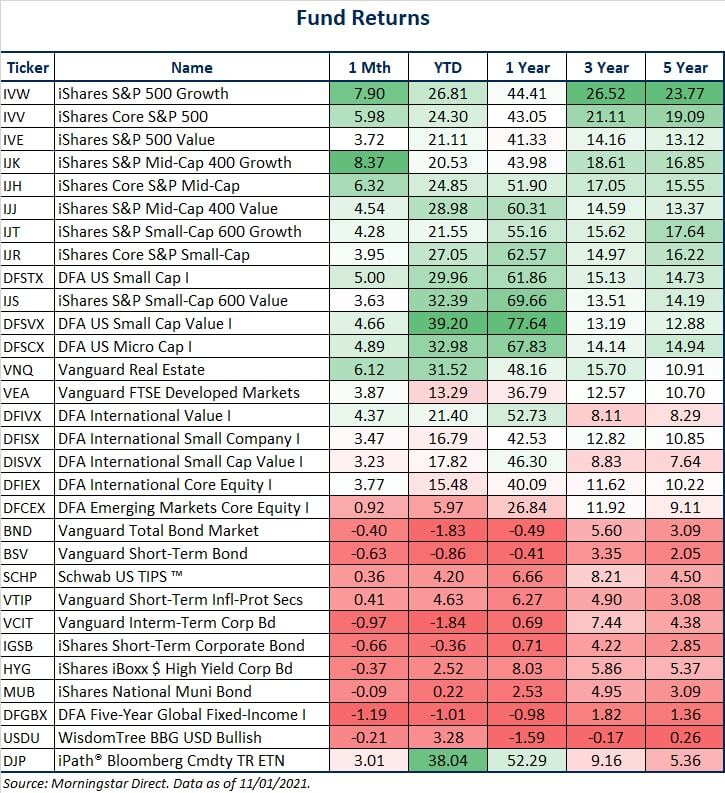
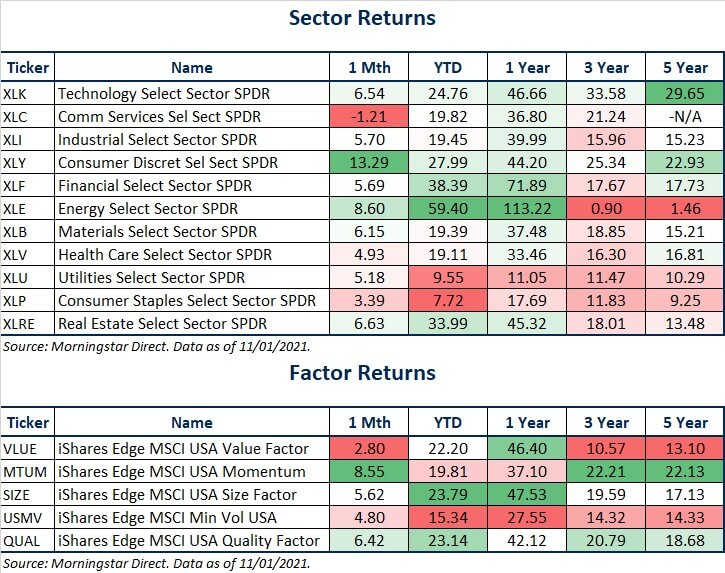
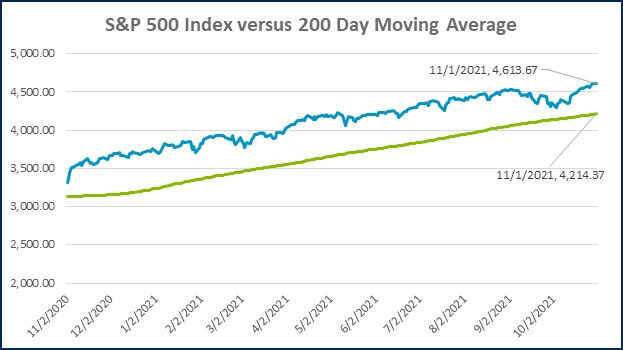
Source: Morningstar Direct.
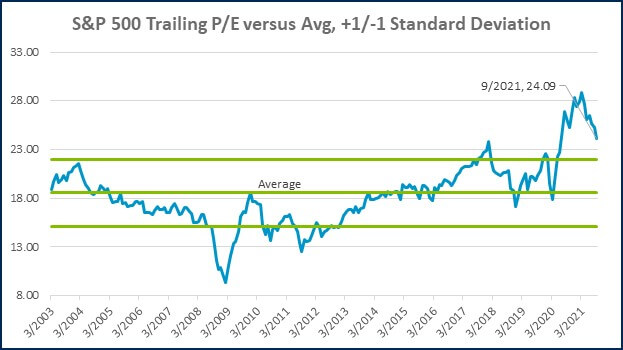
Source: Morningstar Direct.
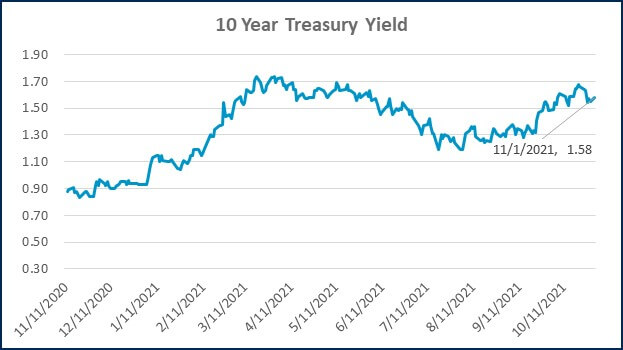
Source: Treasury.gov
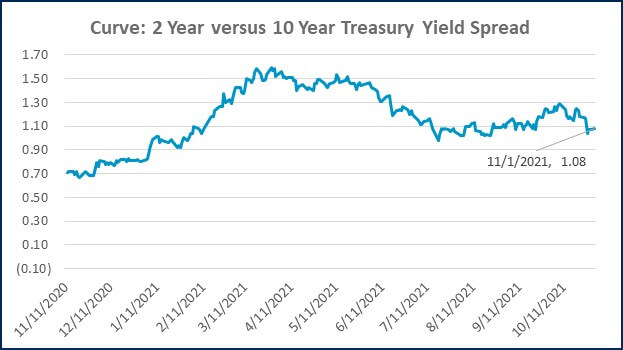
Source: Treasury.gov
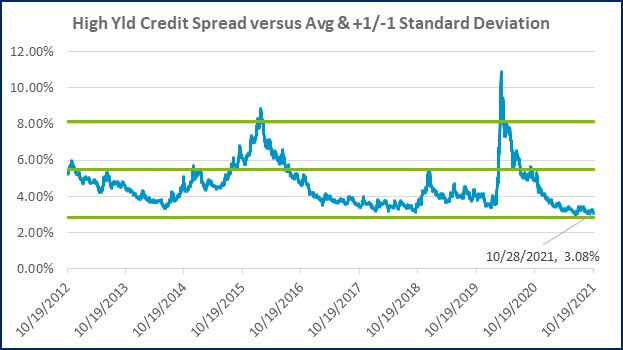
Source: FRED Database & ICE Benchmark Administration Limited (IBA)
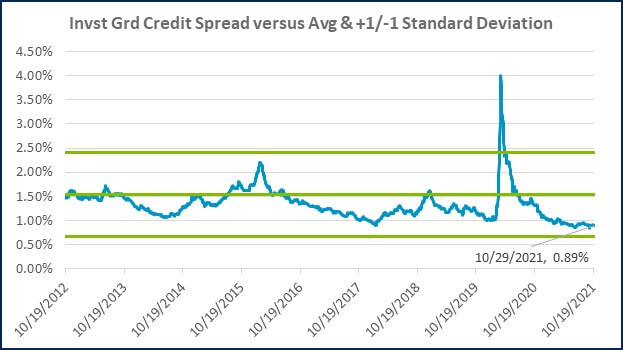
Source: FRED Database & ICE Benchmark Administration Limited (IBA)

- Competition, Achiever, Relator, Analytical, Ideation
Josh Jenkins, CFA
Josh Jenkins, Chief Investment Officer, began his career in 2010. With a background in investment analysis and portfolio management from his previous roles, he quickly advanced to his current leadership position. As a member of the Lutz Financial Board and Chair of the Investment Committee, he guides Lutz Financial’s investment strategy and helps to manage day-to-day operations.
Leading the investment team, Josh directs research initiatives, while overseeing asset allocation, fund selection, portfolio management, and trading. He authors the weekly Financial Market Update, providing clients with timely insights on market conditions and economic trends. Josh values the analytical nature of his work and the opportunity to collaborate with talented colleagues while continuously expanding his knowledge of the financial markets.
At Lutz, Josh exemplifies the firm’s commitment to maintaining discipline and helping clients navigate market uncertainties with confidence. While staying true to the systematic investment process, he works to keep clients' long-term financial goals at the center of his decision-making.
Josh lives in Omaha, NE. Outside the office, he likes to stay active, travel, and play golf.
Recent News & Insights

Recruiting medical talent? Know the Tax Implications of Modern Compensation Packages

How Stay Interviews Help Retain High Performers

The Importance of Hiring an M&A Team

Treasury Management: Strategies to Improve Financial Stability & Growth

