.jpg?width=300&height=175&name=Mega%20Menu%20Image%20(1).jpg)
%20(1).jpg?width=300&height=175&name=Mega%20Menu%20Image%20(2)%20(1).jpg)
%20(1)-Mar-08-2024-09-27-14-7268-PM.jpg?width=300&height=175&name=Untitled%20design%20(6)%20(1)-Mar-08-2024-09-27-14-7268-PM.jpg)

%20(1)-Mar-08-2024-09-11-30-0067-PM.jpg?width=300&height=175&name=Untitled%20design%20(3)%20(1)-Mar-08-2024-09-11-30-0067-PM.jpg)
%20(1).jpg?width=300&height=175&name=Mega%20Menu%20Image%20(3)%20(1).jpg)
%20(1).jpg?width=300&height=175&name=Mega%20Menu%20Image%20(4)%20(1).jpg)
%20(1).jpg?width=300&height=175&name=Mega%20Menu%20Image%20(5)%20(1).jpg)
-Mar-08-2024-08-50-35-9527-PM.png?width=300&height=175&name=Untitled%20design%20(1)-Mar-08-2024-08-50-35-9527-PM.png)


.jpg)


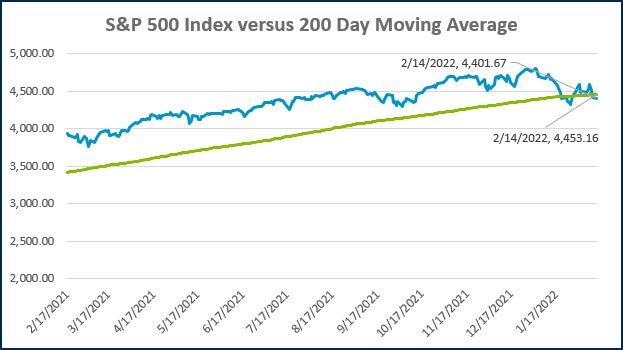
The Federal Reserve has been telegraphing its intention to begin normalizing monetary policy since late last year. As updated data continues to be published, such as the multi-decade high reading from the Consumer Price Index (CPI) report last week, investors are becoming convinced that the Fed may be behind the curve in combating inflation. As a result, the market went from pricing at a modest pace of rate increases to one that is aggressive relative to recent standards.
2021 was not a particularly good year for the bond market. The Bloomberg Barclays Aggregate Bond Index, a proxy for the U.S. bond market, returned -1.54%. This marks the first annual loss for the bond market since 2013, the year the Fed began to normalize policy following the Financial Crisis of 2008. It’s also just the 4th annual loss for bonds since the inception of the Aggregate Index 42 years ago.
2022 is off to a rocky start as well. As the market has priced in an increasingly aggressive Fed, the bond selloff has intensified. Through yesterday’s close (2/14), the Aggregate Index is down -3.96% year-to-date. Understandably, the increased volatility has some investors questioning whether they should still own bonds in the first place. There are a few compelling reasons we believe owning bonds continues to make sense today.
The most critical function of bonds is to serve as a ballast for the overall portfolio. Bond prices have historically fluctuated much less than their equity counterparts. This is evident in the chart below, which illustrates the relative scale of selloffs between the two asset classes based on rolling 12-month returns. As you can see, even a relatively benign equity selloff dwarfs the largest bond selloff.
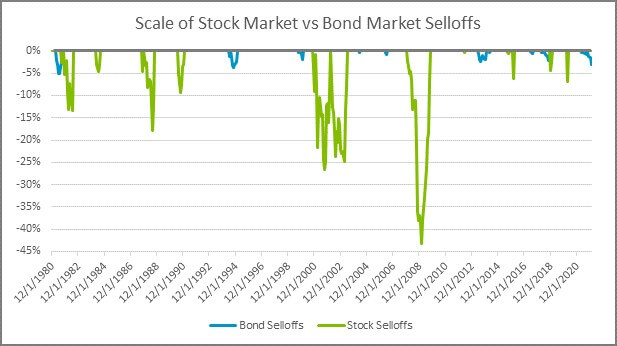
Source: Morningstar Direct. Data from 1/31/1980 to 1/31/2022. Stocks are represented by the S&P 500 TR USD Index and bonds are represented by the Bloomberg Barclays Aggregate Bond Index. Returns are based on monthly data calculated in rolling 12-month windows.
Additionally, over the last twenty years, the correlation between stocks and bonds has been -.04. This means that the two asset classes tend to march to the beat of their own drums. To the extent that they do move in tandem, the slightly negative measure suggests they move in opposite directions of each other. This has the tendency to manifest itself when stocks come under pressure. In those scenarios, there is often what is referred to as a “flight to quality,” where investors dump risky assets in pursuit of something more stable, including investment-grade bonds.
The chart below provides some recent examples of this. It illustrates five of the largest stock market selloffs since the Financial Crisis. Not only did bonds hold up relatively well, but they also managed to generate a positive return in all five scenarios. In each case, bonds would have offered a diversified investor a smoother ride and the ability to rebalance appreciated bond holdings into discounted equities.
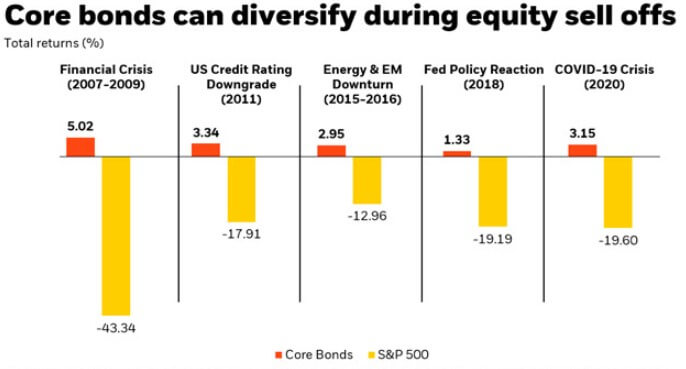
Source: Blackrock. Data from Bloomberg. Core Bonds represented by the Bloomberg Barclays US Aggregate Bond Index. Financial Crisis measured from 10/10/07-3/9/09. US Credit Rating Downgrade measured 7/25/11-10/3/11, Energy and EM downturn measured 7/21/15-2/11/16, Fed Policy Reaction measured 10/3/18-12/24/18, Covid-19 Crisis measured 1/1/20-3/31/20.
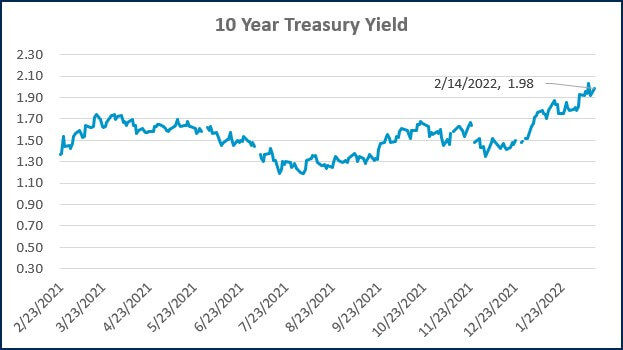
Bond prices move inversely with interest rates. As yields rise, prices fall, and vice versa. While periods of rising interest rates can be painful as the value of bond holdings decline, there is a silver lining. Future interest payments will be invested at the new higher rates and expected returns for the bond allocation moving forward will have increased. For this reason, fixed income is sometimes referred to as the ‘self-healing asset class.’ In the long run, investors are better off enduring the short-term pain to obtain the higher long-term expected returns that ultimately follow.
Some investors understand the long-term benefits of higher interest rates but attempt to avoid the short-term pain required to get there. They effectively wish to time the market and sell out of their bonds until the climb in yields has run its course. This sounds like a great strategy; unfortunately, very few people are successful at this sort of guessing game.
Three months ago, the market consensus was that there wasn’t going to be a rate hike at the March 16 meeting. A month later, the market was pricing in a 50% chance of a 0.25% hike. Now the market is pricing in a 0.50% hike as the most likely scenario. If that comes to fruition, it would be the first time the Fed has hiked by more than 0.25% at once since the mid-2000s. The point I’m trying to make here is that no one has any special insight into how this is going to unfold. The situation will remain fluid, and the narrative has the potential to turn on a dime. It already has several times in recent months.
It’s possible the Fed continues to intensify its aggressive posture, and that would certainly result in more volatility. It’s also possible that tighter monetary policy pushes the economy towards a recession, or the crisis with Russia and Ukraine erupts into an all-out war. Either of these scenarios could result in a flight to quality that presses bond yields lower. Additionally, inflation pressures could begin to abate, which could lead to a more modest path of expected rate increases.
As it stands, the market is pricing in seven (0.25%) hikes for 2022 as the most likely scenario. That would leave the benchmark Fed Funds rate in the range of 1.75% to 2.00%. A substantial portion of this move is already reflected in prices. Selling out of one’s bond allocation now would mean an investor endured much of the pain without sticking around for the potential reward.
WEEK IN REVIEW
- The January reading of the Consumer Price Index (CPI) was published last Thursday, showing the pace of headline inflation increased to 7.5% YoY. Core CPI, which strips out the volatile food and energy components, increased 6.0% YoY. Each figure represents a multi-decade high. Rents, which comprise about a third of the index, increased 5.3% YoY. Other components contributing to the high inflation reading include used car prices (+40.5% YoY) and energy (+27.0% YoY).
- Earnings season continues to progress, with 72% of S&P 500 companies having reported 4th quarter results. The earnings growth rate of companies that have reported, blended with the estimates for companies that have yet to report, increased to 30.3% YoY. Entering earnings season, projected YoY growth was 21.3%. A continuation of strong earnings growth will be needed to help fuel continued stock market appreciation.
- Data to be published this week includes retail sales and industrial production on Wednesday, jobless claims on Thursday, and the Index of Leading Economic Indicators on Friday. Additionally, the Fed will publish the minutes from its last meeting on Wednesday.
HOT READS
Markets
- U.S. Inflation Rate Accelerates to a 40-Year High of 7.5% (WSJ)
- Farmers Feel the Squeeze of Inflation (WSJ)
- A New Inflation Reading Shows the Small Business Tipping Point Has Been Reached (CNBC)
Investing
- The Trouble With a Stock-Market Bubble (Jason Zweig)
- Forecasting is hard because trivial accidents can be influential in ways that are impossible to foresee (Morgan Housel)
- Is Housing a Good Investment (Ben Carlson)
Other
- How Olympic Figure Skaters Break Records with Physics (Scientific American)
- The Story of How the Super Bowl Champions Came Together is Beyond Belief (Sports Illustrated)
- The Greatest Physics Demo of All Time Happened on the Moon (Wired)
MARKETS AT A GLANCE
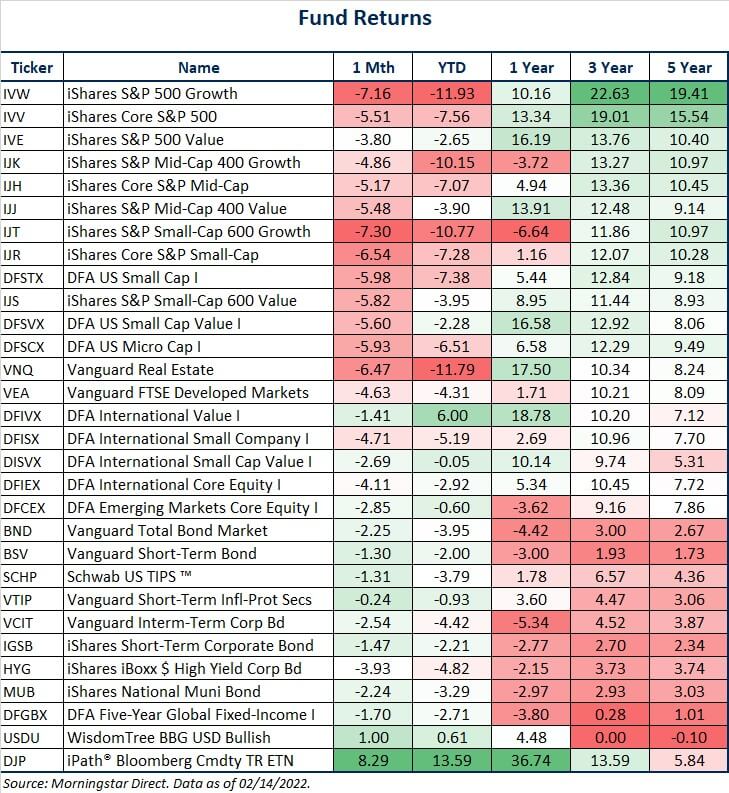
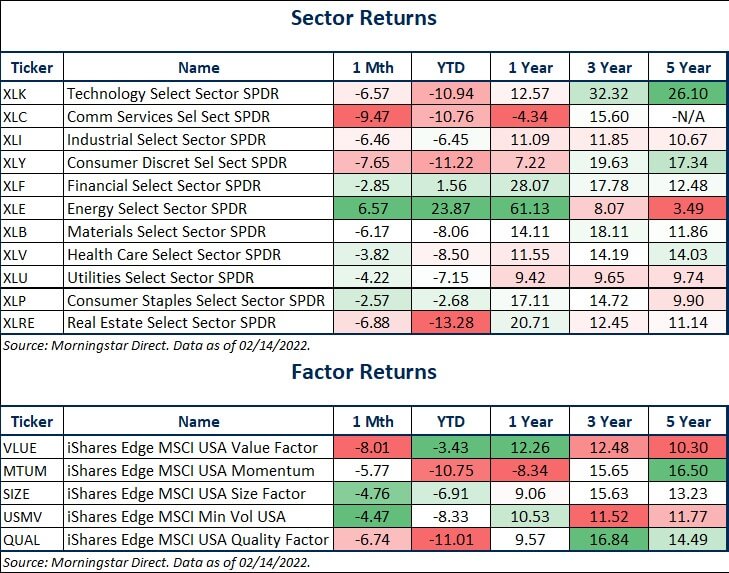
Source: Morningstar Direct.
Source: Morningstar Direct.
Source: Treasury.gov
Source: Treasury.gov
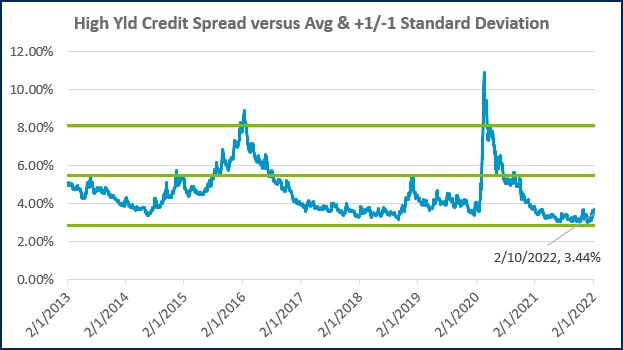
Source: FRED Database & ICE Benchmark Administration Limited (IBA)
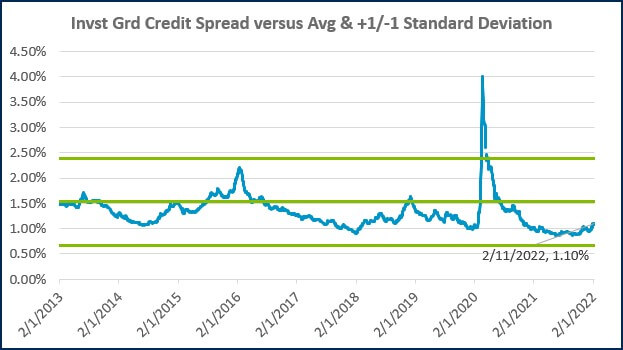
Source: FRED Database & ICE Benchmark Administration Limited (IBA)
ECONOMIC CALENDAR
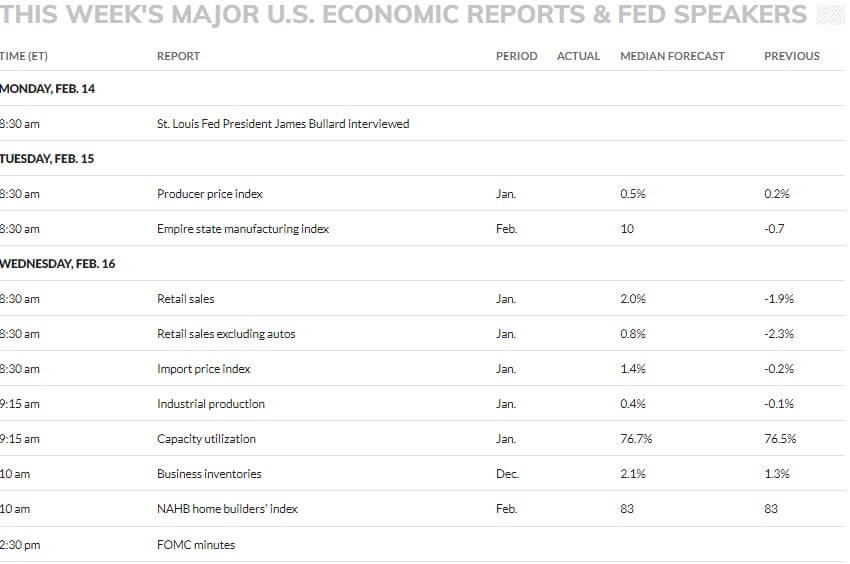
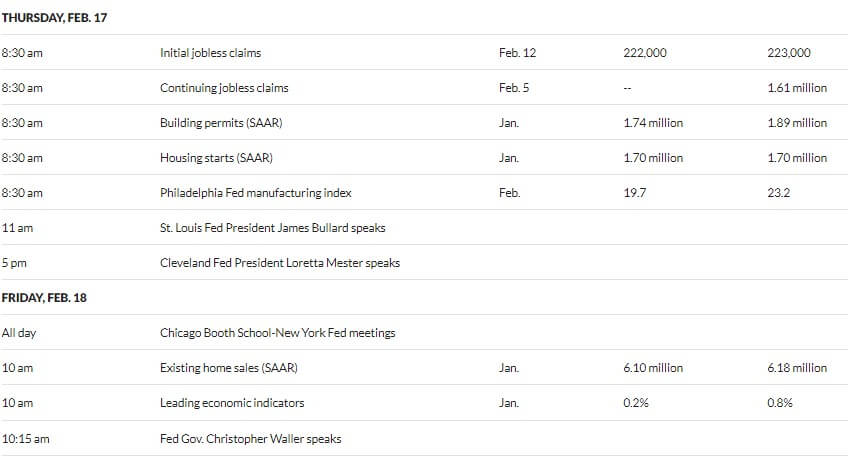
Source: MarketWatch

- Competition, Achiever, Relator, Analytical, Ideation
Josh Jenkins, CFA
Josh Jenkins, Chief Investment Officer, began his career in 2010. With a background in investment analysis and portfolio management from his previous roles, he quickly advanced to his current leadership position. As a member of the Lutz Financial Board and Chair of the Investment Committee, he guides Lutz Financial’s investment strategy and helps to manage day-to-day operations.
Leading the investment team, Josh directs research initiatives, while overseeing asset allocation, fund selection, portfolio management, and trading. He authors the weekly Financial Market Update, providing clients with timely insights on market conditions and economic trends. Josh values the analytical nature of his work and the opportunity to collaborate with talented colleagues while continuously expanding his knowledge of the financial markets.
At Lutz, Josh exemplifies the firm’s commitment to maintaining discipline and helping clients navigate market uncertainties with confidence. While staying true to the systematic investment process, he works to keep clients' long-term financial goals at the center of his decision-making.
Josh lives in Omaha, NE. Outside the office, he likes to stay active, travel, and play golf.
Recent News & Insights

Update: Tax Highlights of “The One, Big, Beautiful Bill”

From Seed to Scale: Tax & Operational Strategies for AgTech Startups

Case Study: A Smarter 401(k) Strategy for a Busy Doctor's Office

Recruiting medical talent? Know the Tax Implications of Modern Compensation Packages

