.jpg?width=300&height=175&name=Mega%20Menu%20Image%20(1).jpg)
%20(1).jpg?width=300&height=175&name=Mega%20Menu%20Image%20(2)%20(1).jpg)
%20(1)-Mar-08-2024-09-27-14-7268-PM.jpg?width=300&height=175&name=Untitled%20design%20(6)%20(1)-Mar-08-2024-09-27-14-7268-PM.jpg)

%20(1)-Mar-08-2024-09-11-30-0067-PM.jpg?width=300&height=175&name=Untitled%20design%20(3)%20(1)-Mar-08-2024-09-11-30-0067-PM.jpg)
%20(1).jpg?width=300&height=175&name=Mega%20Menu%20Image%20(3)%20(1).jpg)
%20(1).jpg?width=300&height=175&name=Mega%20Menu%20Image%20(4)%20(1).jpg)
%20(1).jpg?width=300&height=175&name=Mega%20Menu%20Image%20(5)%20(1).jpg)
-Mar-08-2024-08-50-35-9527-PM.png?width=300&height=175&name=Untitled%20design%20(1)-Mar-08-2024-08-50-35-9527-PM.png)


.jpg)


STORY OF THE WEEK
WHAT A YIELD CURVE INVERSION MEANS FOR INVESTORS
As the 2nd quarter began, an unusual and potentially ominous warning signal began to flash. While it garnered meaningful media attention at the time, the signal quickly shut back off. I am referring to, of course, the inversion of the yield curve. If you are unfamiliar with or want to understand it better, here is a quick summary of what it is and what it could potentially mean for investors.
What is the Yield Curve?
As you can see in the chart below, the yield curve is a simple graphical representation of bond yields across various maturities. You may also hear the yield curve referred to as the “term structure of interest rates.” When discussed in the financial media, the yield curve almost always corresponds to US Treasury bonds.
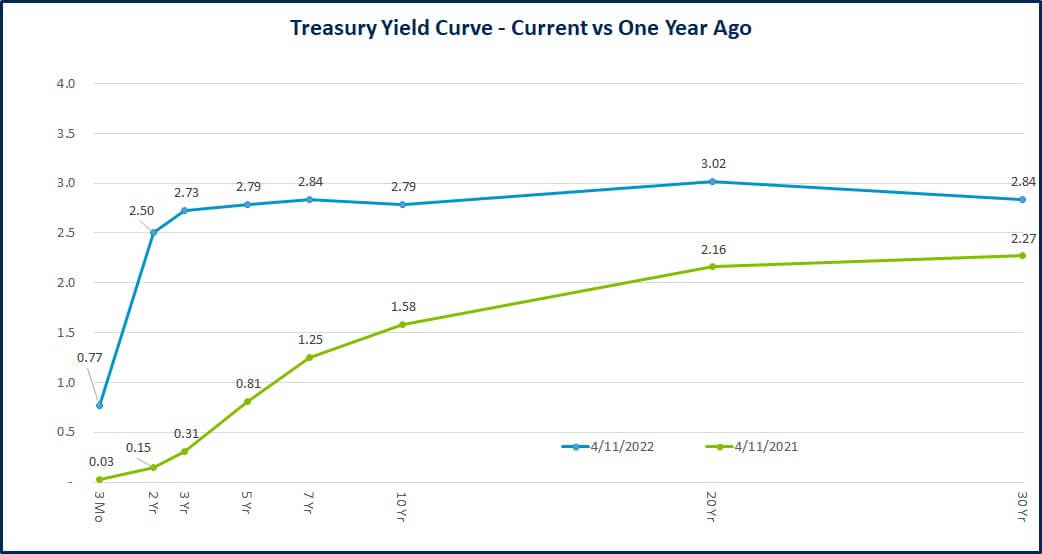
Source: Treasury.gov
Under normal market conditions, the yield curve is upward sloping. Bonds with a longer term to maturity generally carry more interest rate, inflation, and default risk. As a result, prospective buyers require a higher rate of return on these bonds to compensate for that increased risk. The green line on the above chart, which demonstrates the shape of the curve last year, provides a good illustration of a normal yield curve. As you can see, yields gradually increased as you pushed further out on the curve.
What Is a Yield Curve Inversion?
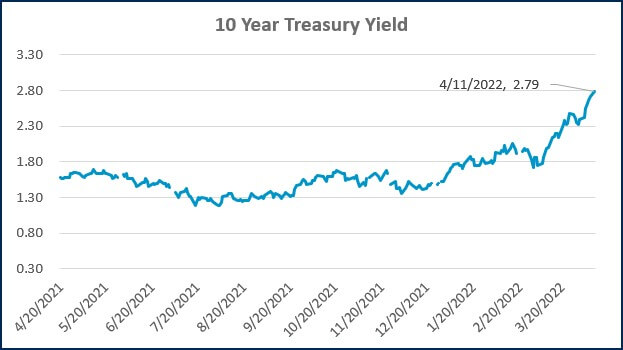
A yield curve inversion describes a scenario where longer-term rates are lower than shorter-term rates. The blue line in the above chart represents the yield curve as of yesterday’s market close. The curve remains inverted in a few areas. For example, the 7-Year yield (2.84%) is higher than the 10-Year yield (2.79%), while the 20-Year yield (3.02%) is higher than the 30-Year yield (2.84%). Investors don’t pay much attention to these spreads, however. There are two measures that generate the majority of headlines; these include the 3-Month versus 10-Year and the 2-Year versus 10-Year curves. It was the latter that briefly inverted earlier this month.
The 3-Month Treasury yield generally tracks the benchmark federal funds rate closely. While the Federal Reserve has foreshadowed a relatively fast pace of interest rate increases over the next year, it’s only actually done a single 0.25% hike thus far. Conversely, the 2-Year yield largely reflects where investors think short-term rates are heading and has already priced in a substantial amount of hiking activity. As a result, there is a large spread between the 3-month and 2-year yields. You may hear the financial media describe the front end of the curve as “steep.” Conversely, there is not much spread between 2-Year yields all the way out to 30-year yields. That section of the curve would generally be described as “flat.”
Implications of an Inverted Yield Curve
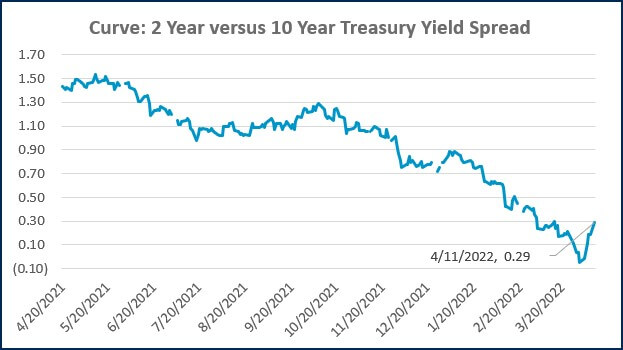
Investors pay close attention to the yield curve because it has historically been one of the most accurate early warning signals for a looming recession. As the chart below shows, the spread between the two and 10-Year Treasury yield went negative (inverted) ahead of each of the last six recessions. The track record would be even stronger if data on the 2-Year yield went further. There were two additional recessions in the early 1970s that were preceded by inversions of the 3-Month vs. 10-Year curve, which has a longer history.
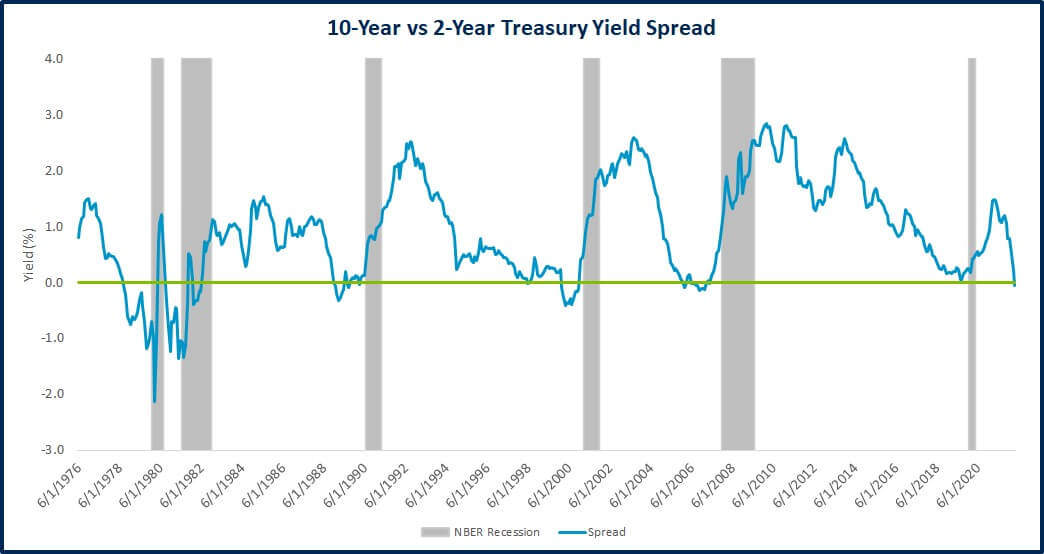
Source: Fred Database. Data from 6/30/1976 to 4/1/2022.
With inflation accelerating at the most rapid pace in decades, the Federal Reserve has shifted towards tightening monetary policy. While the Fed can exert considerable force on short-term rates through its management of the benchmark fed funds rate, longer-term rates generally fluctuate based on expectations for economic growth. One explanation for the recent curve flattening (and brief inversion) is that investors are concerned the Fed’s policy tightening will tip the economy into a recession.
Despite its strong track record as an early warning signal, not everyone is convinced the yield curve has any special explanatory power. For starters, the six to eight recessions discussed here hardly constitute a sufficient sample size to draw meaningful statistical conclusions. Additionally, there has historically been substantial variation between an inversion and the onset of a subsequent recession. In the case of the Financial Crisis (2008), the recession came almost a full two years after the initial inversion. There has also been a rather dramatic range of equity market performances following an inversion. As a result, the efficacy of the yield curve as a timing mechanism has historically been quite poor.
Finally, the Federal Reserve is acutely aware that its policy tightening risks pushing the economy into a recession. Ideally, they would be able to thread the needle and pump the breaks on the economy just enough to stabilize prices but avoid causing a recession. This is commonly described as “engineering a soft landing.” An example of this balancing act came in 2019 when the Federal Reserve reversed course and began cutting rates in response to market signals of a coming economic slowdown. It’s possible they would have been successful if not for the pandemic that followed a few months later. Ultimately, it’s unclear if the brief inversion means we are heading towards a recession, and it provides even less information as to when it would arrive. The tremendous strength in the labor market, however, suggests that the economy should retain some momentum in the near-term.
WEEK IN REVIEW
- Data published by the Bureau of Labor Statistics (BLS) showed inflation continues to accelerate at the fastest pace in decades. The Consumer Price Index (CPI) increased 8.5% YoY, which was slightly faster than economists’ expectations, according to MarketWatch. Core CPI, which excludes the volatile food and energy components, increased 6.5% YoY. Shelter, which comprises about 1/3 of the Core CPI measure, was a large contributor on a month-over-month basis and is expected to continue to power core inflation higher.
- Earnings season is quickly approaching. How companies have performed thus far as inflation has accelerated and the forward guidance provided will likely set the tone for how the market performs in the coming months.
- Important economic data to be published later this week includes retail sales, jobless claims and consumer sentiment on Thursday. On Friday, we will get an update on industrial production and capacity utilization.
ECONOMIC CALENDAR
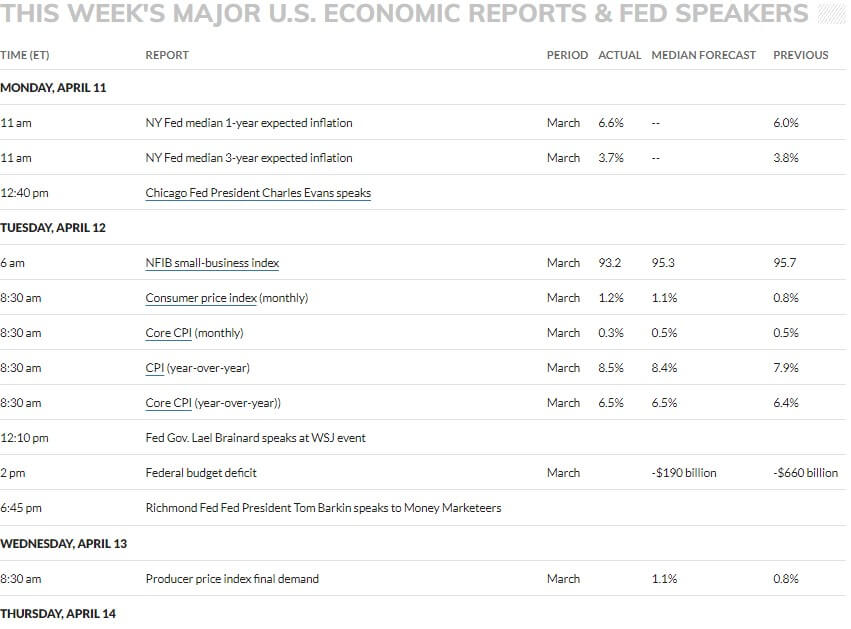
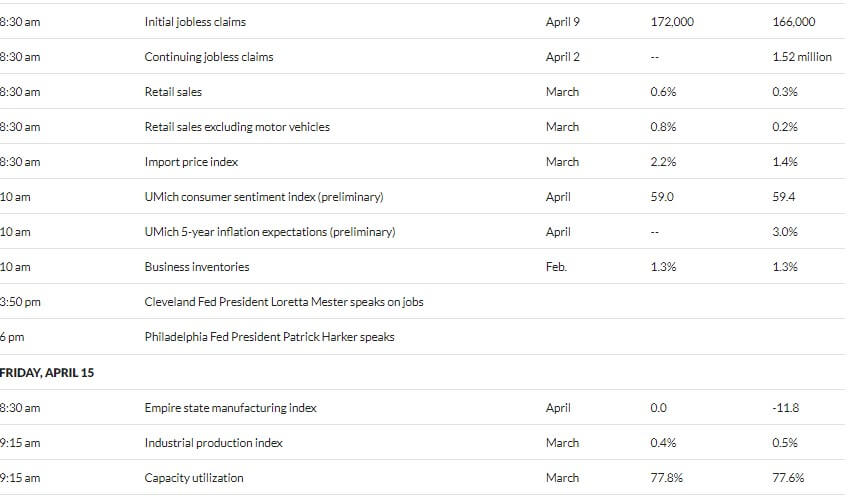
Source: MarketWatch
HOT READS
Markets
- Earnings Season Poses Next Trail For Volatile Stock Market (WSJ)
- Consumer Prices Rose 8.5% in March, Slightly Hotter Than Expected and the Highest Since 1981 (CNBC)
- Where Inflation Rose, Cooled the Most in March (WSJ)
Investing
- 5 Things I know About Investing (Kenneth French)
- Deep Roots Why Forecasting is So Difficult (Morgan Housel)
- What the Labor Market Means for the Stock Market (Ben Carlson)
Other
- 60 Minutes Interview with Ukrainian President Volodymyr Zelenskyy (60 Minutes)
- What Cities Lose When They Lose Pro Sports (The Ringer)
- Weddings are Booming Again, and the Industry is Struggling to Keep Up (Washington Post)
MARKETS AT A GLANCE
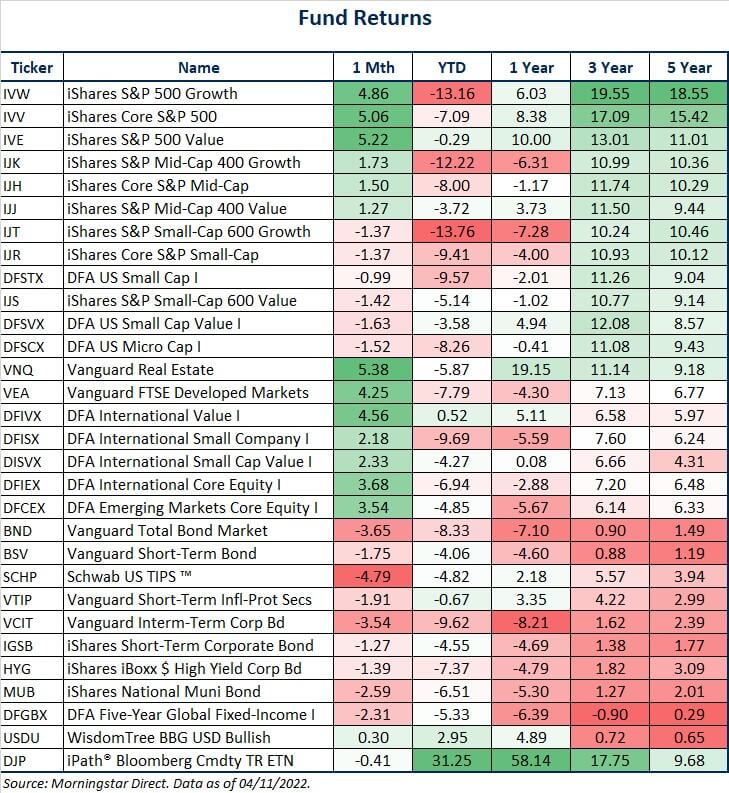
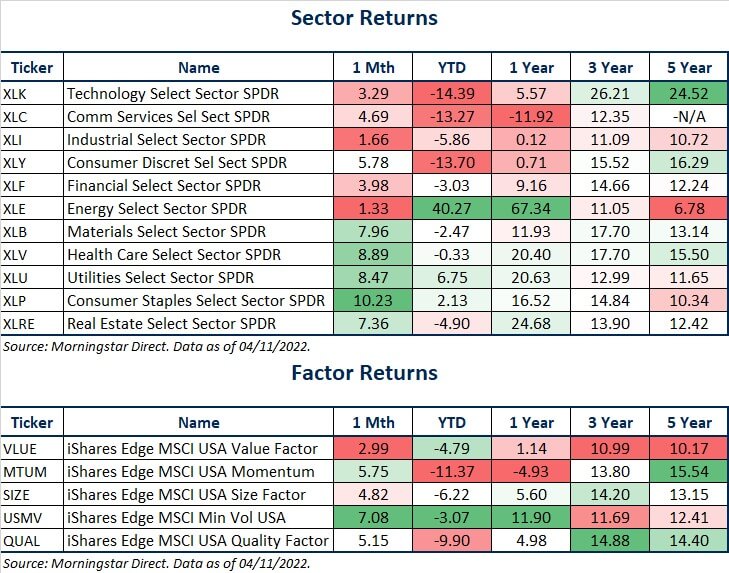
Source: Morningstar Direct.
Source: Morningstar Direct.
Source: Treasury.gov
Source: Treasury.gov
Source: FRED Database & ICE Benchmark Administration Limited (IBA)
Source: FRED Database & ICE Benchmark Administration Limited (IBA)
IMPORTANT DISCLOSURE INFORMATION
- Competition, Achiever, Relator, Analytical, Ideation
Josh Jenkins, CFA
Josh Jenkins, Chief Investment Officer, began his career in 2010. With a background in investment analysis and portfolio management from his previous roles, he quickly advanced to his current leadership position. As a member of the Lutz Financial Board and Chair of the Investment Committee, he guides Lutz Financial’s investment strategy and helps to manage day-to-day operations.
Leading the investment team, Josh directs research initiatives, while overseeing asset allocation, fund selection, portfolio management, and trading. He authors the weekly Financial Market Update, providing clients with timely insights on market conditions and economic trends. Josh values the analytical nature of his work and the opportunity to collaborate with talented colleagues while continuously expanding his knowledge of the financial markets.
At Lutz, Josh exemplifies the firm’s commitment to maintaining discipline and helping clients navigate market uncertainties with confidence. While staying true to the systematic investment process, he works to keep clients' long-term financial goals at the center of his decision-making.
Josh lives in Omaha, NE. Outside the office, he likes to stay active, travel, and play golf.
Recent News & Insights

Update: Tax Highlights of “The One, Big, Beautiful Bill”

From Seed to Scale: Tax & Operational Strategies for AgTech Startups

Case Study: A Smarter 401(k) Strategy for a Busy Doctor's Office

Recruiting medical talent? Know the Tax Implications of Modern Compensation Packages

