.jpg?width=300&height=175&name=Mega%20Menu%20Image%20(1).jpg)
%20(1).jpg?width=300&height=175&name=Mega%20Menu%20Image%20(2)%20(1).jpg)
%20(1)-Mar-08-2024-09-27-14-7268-PM.jpg?width=300&height=175&name=Untitled%20design%20(6)%20(1)-Mar-08-2024-09-27-14-7268-PM.jpg)

%20(1)-Mar-08-2024-09-11-30-0067-PM.jpg?width=300&height=175&name=Untitled%20design%20(3)%20(1)-Mar-08-2024-09-11-30-0067-PM.jpg)
%20(1).jpg?width=300&height=175&name=Mega%20Menu%20Image%20(3)%20(1).jpg)
%20(1).jpg?width=300&height=175&name=Mega%20Menu%20Image%20(4)%20(1).jpg)
%20(1).jpg?width=300&height=175&name=Mega%20Menu%20Image%20(5)%20(1).jpg)
-Mar-08-2024-08-50-35-9527-PM.png?width=300&height=175&name=Untitled%20design%20(1)-Mar-08-2024-08-50-35-9527-PM.png)


.jpg)


With inflation at the highest level in decades, the Federal Reserve (Fed) has begun removing the substantial degree of monetary policy accommodation that has been in place for the past several years. This includes a combination of raising short-term interest rates, ending its bond purchase program, and ultimately reducing the size of its balance sheet. The objective of this policy shift is to tap the breaks on the economy and reduce the high level of demand that has contributed to rising prices. The Fed aims to do this without pushing the economy into a recession; an outcome commonly referred to as a ‘soft landing.’ Whether or not the Fed can do this successfully remains to be seen. Much of the stock market volatility we have experienced this year has stemmed from the market pricing in some probability that the Fed will be unsuccessful.
Every day, millions of buy and sell decisions made by investors incorporate known information and expectations for the future into stock prices. This makes the market an incredibly efficient mechanism for pricing stocks in a manner that balances the negative views of those that are selling, with the positive views of those that are buying. The price for an investment at any given point in time represents the equilibrium level that balances those opposing views.
When the market is experiencing severe and/or prolonged levels of volatility, it is natural for investors to seek safety by selling stocks or refraining from investing funds they otherwise would have. Engaging in this activity equates to timing the market. To do this successfully, an investor must either A) be willing to roll the dice and hope they get lucky when they decide to sell AND buy back in, or B) possess superior information than what is being priced into the market by the millions of buy and sell decisions that occur from all other investors around the globe.
Every now and then, there is a third option that may provide the opportunity for investors to successfully time the market. This occurs when markets reach an extreme level of fear or greed. Typically, brave investors who purchased risky assets during the depth of major bear market selloffs have historically seen a solid payoff. An example would have been buying stocks in mid to late March of 2020. Conversely, investors who sold or otherwise avoided select assets experiencing a bubble-like parabolic rise in prices have also historically been better off. An example here would be investors in 2021 that avoided Special Purpose Acquisition Companies (SPACs), crypto-currencies, and highflying technology companies, whose prices were popularly believed to be heading ‘to the moon.’ With the S&P 500 currently down 10-15%, it’s hard to argue that we are currently anywhere near one of these extreme environments.
The chart below was recently published by Dimensional Fund Advisors. It shows one way attempting to time the market can be risky. While holding cash can protect a portfolio from a decline in asset prices, it exposes investors to the opportunity cost of missed returns if prices were to instead rise.
The dark bar on the left side of the chart demonstrates the wealth generated by an investor that purchased stocks in 1997 and simply held them over the next 25 years. During that time, the initial $1,000 investment would have grown to over $10,000! Keep in mind, during this period, the market endured:
- The 9/11 terrorist attacks
- The wars in Iraq and Afghanistan
- The technology stock bubble bursting and recession
- The housing market bubble bursting and Financial Crisis
- The US Government Debt downgrade
- The trade war with China
- The pandemic and recession
- Multiple Federal Reserve tightening cycles
Despite all these dramatic events, staying the course would have earned the disciplined investor a ten-fold return. The four lighter shaded bars in the graph illustrate the risk associated with trying to outguess the market. Missing out on the best week, month, 3-month, or 6-month period, resulted in a dramatically lower level of ending wealth. This outcome is very possible for two reasons.
Russell 3000 Index Total Return
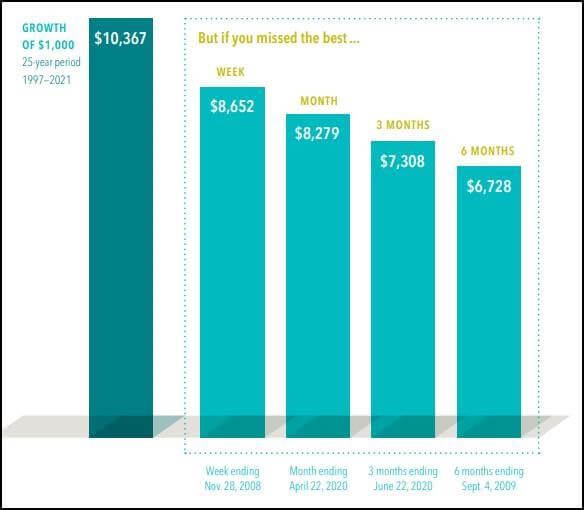
Source: Dimensional Fund Advisors. In US dollars. For illustrative purposes. Best performance dates represent end of period (Nov. 28, 2008, for best week; April 22, 2020, for best month; June 22, 2020, for best 3 months; and Sept. 4, 2009, for best 6 months). The missed best consecutive days examples assume that the hypothetical portfolio fully divested its holdings at the end of the day before the missed best consecutive days, held cash for the missed best consecutive days, and reinvested the entire portfolio in the Russell 3000 Index at the end of the missed best consecutive days. Frank Russell Company is the source and owner of the trademarks, service marks, and copyrights related to the Russell Indexes.
First is the notion of volatility clustering. Simply put, this means large price swings tend to be grouped together over time. An investor that wishes to sell following a steep drop in the market may avoid further large declines but may be just as likely to miss a large rally. This phenomenon was on full display during the pandemic-related market selloff. After reaching the bottom on 3/23/2020, the S&P 500 rallied approximately 17% in just three trading days.
This brings us to the second reason. Even if an investor were to correctly anticipate an approaching downturn and sold stocks prior to any price declines, there is still the question of when to get back into the market. Unfortunately, there is no ‘all clear’ signal when it is ‘safe’ to buy stocks. For years after the Financial Crisis, investors were skeptical about the longevity of the rally and continued calls for a double-dip recession. Of course, those calls proved to be misguided, as the market went on to enjoy one of the longest bull markets on record.
Investors that sit on the sidelines during heightened volatility often remain there for extended periods. Ultimately, this can be disastrous for long-term wealth creation.
WEEK IN REVIEW
- 99% of S&P 500 companies have reported earnings results for Q1, according to FactSet. The earnings growth rate is currently estimated at 9.2%, compared to a forecast of 3.8% coming into earnings season. The combination of continued earnings growth and the recent decline in stock prices has moved valuations from very stretched towards being fairly priced. All else being equal, this is a positive for stock returns moving forward.
- All eyes continue to be on the Federal Reserve as they move to combat inflation. The next policy meeting will conclude on Wednesday, 6/15. The consensus expectation is that the market will do another 0.50% hike to the fed funds rate, bringing the target range to 1.25%-1.50%. The market is currently pricing in two additional 0.50% hikes at the July (7/27) and September (9/21) meetings, which would bring the target range to 2.25%-2.50%.
- Economic data to be published this week includes continuing claims on Thursday and will be headlined by the May reading of CPI on Friday.
ECONOMIC CALENDAR
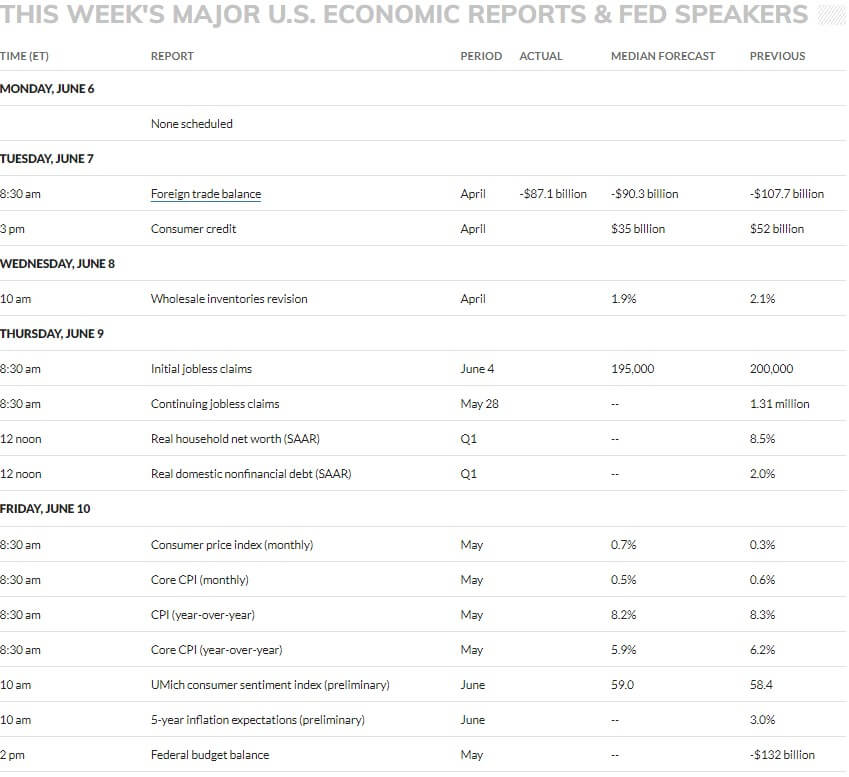
Source: MarketWatch
HOT READS
Markets
- Payrolls rose 390,000 in May, better than expected as companies keep hiring (CNBC)
- U.S. Services-Sector Activity Expands at Slowest Pace Since Early 2021 (MarketWatch)
- Fed Report Sees ‘Slight or modest’ Economic Growth as Inflation Surges (CNBC)
Investing
- Timing a Recession vs. Timing the Stock Market (Ben Carlson)
- Bull Market Rhymes (Howard Marks)
- Endless Uncertainty (Morgan Housel)
Other
- A Disruptor to the PGA Tour is Here, and Professional Golf May Never Be the Same (Sports Illustrated)
- Everything Apple Announced at WWDC 2022: New MacBooks, iOS 16, and More (Wired)
- 9 Under-the-Radar Vacation Spots in Europe (WSJ)
MARKETS AT A GLANCE
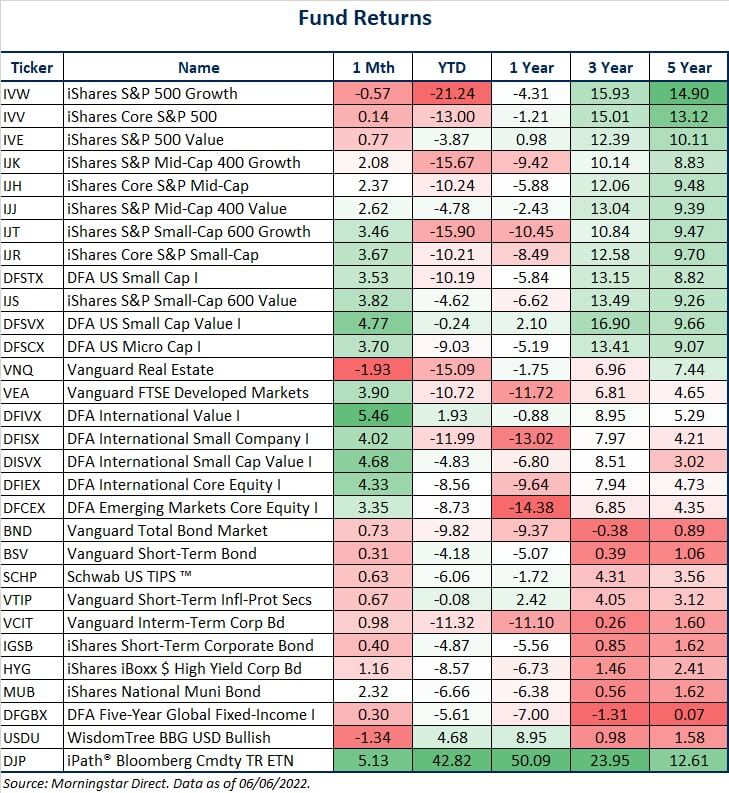
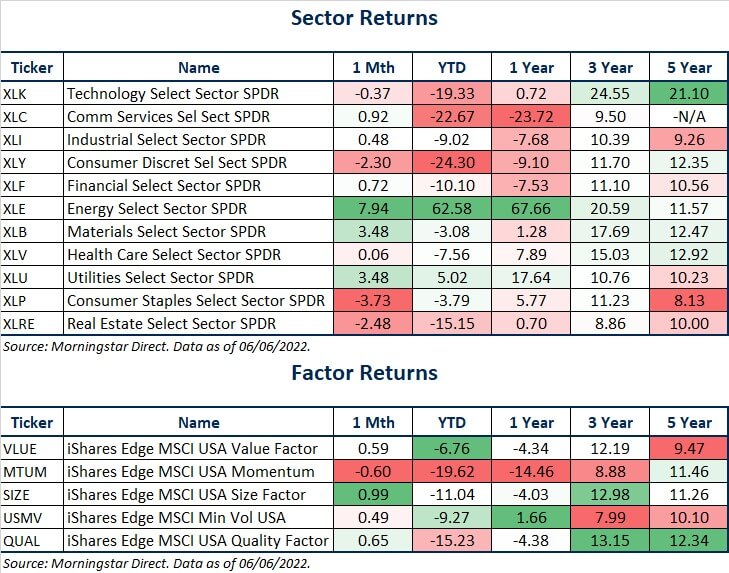
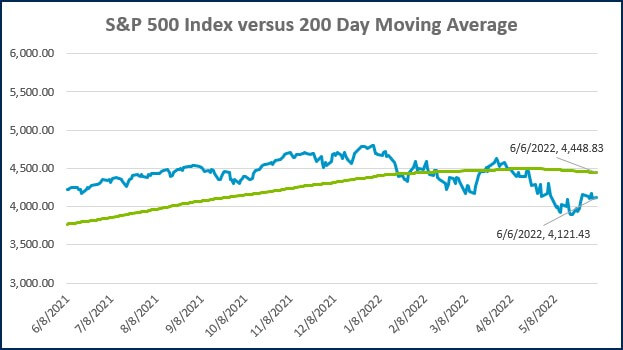
Source: Morningstar Direct.
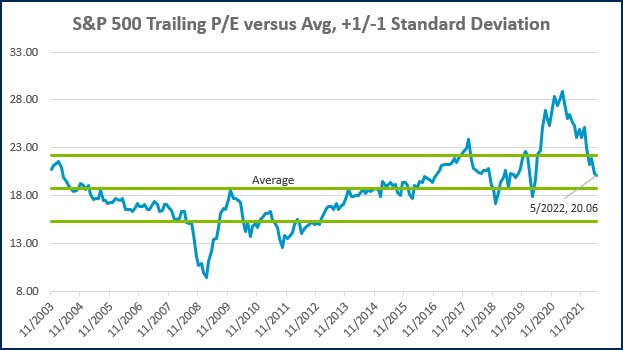
Source: Morningstar Direct.
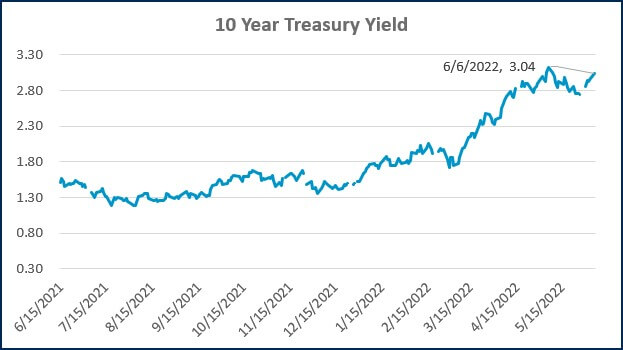
Source: Treasury.gov
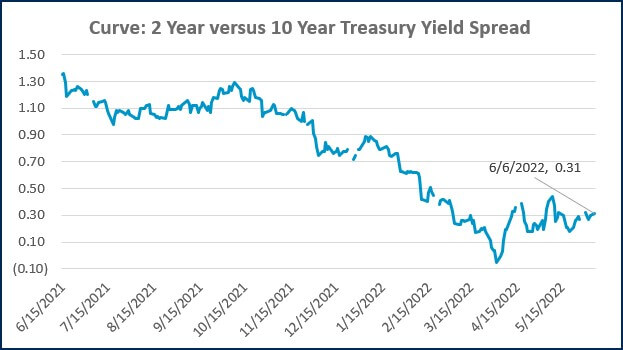
Source: Treasury.gov
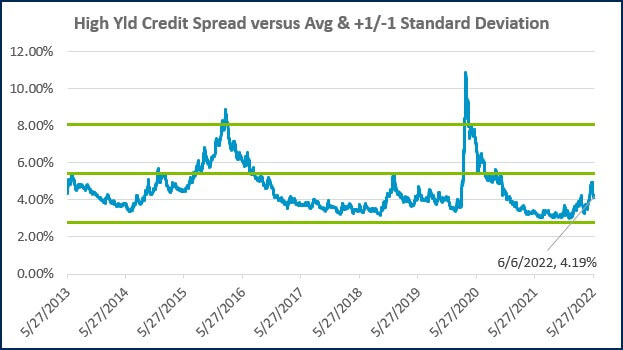
Source: FRED Database & ICE Benchmark Administration Limited (IBA)
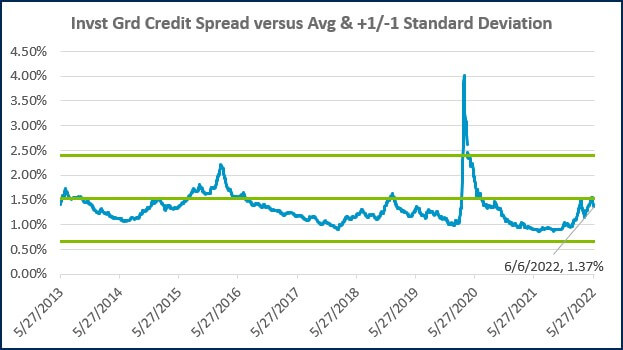
Source: FRED Database & ICE Benchmark Administration Limited (IBA)

- Competition, Achiever, Relator, Analytical, Ideation
Josh Jenkins, CFA
Josh Jenkins, Chief Investment Officer, began his career in 2010. With a background in investment analysis and portfolio management from his previous roles, he quickly advanced to his current leadership position. As a member of the Lutz Financial Board and Chair of the Investment Committee, he guides Lutz Financial’s investment strategy and helps to manage day-to-day operations.
Leading the investment team, Josh directs research initiatives, while overseeing asset allocation, fund selection, portfolio management, and trading. He authors the weekly Financial Market Update, providing clients with timely insights on market conditions and economic trends. Josh values the analytical nature of his work and the opportunity to collaborate with talented colleagues while continuously expanding his knowledge of the financial markets.
At Lutz, Josh exemplifies the firm’s commitment to maintaining discipline and helping clients navigate market uncertainties with confidence. While staying true to the systematic investment process, he works to keep clients' long-term financial goals at the center of his decision-making.
Josh lives in Omaha, NE. Outside the office, he likes to stay active, travel, and play golf.
Recent News & Insights

Recruiting medical talent? Know the Tax Implications of Modern Compensation Packages

How Stay Interviews Help Retain High Performers

The Importance of Hiring an M&A Team

Treasury Management: Strategies to Improve Financial Stability & Growth

