2022 Year in Review + Financial Market Update + 12.27.22

With the major asset classes deep in negative territory, 2022 has been a year most investors would prefer to forget. Here is a brief recap of what was driving the markets during the year and what investors can expect as we enter 2023.
Elevated inflation has been one of the dominant storylines since the economy emerged from the Covid lockdowns in 2020. The upward pressure on prices caused by snarled supply chains and an insufficient supply of labor was widely expected to self-correct. While inflation entered 2021 just below 1.5% on a year-over-year basis, it jumped above 6% by October. Ultimately, the Federal Reserve had to give up on the idea that inflationary pressures were transitory, and it began to signal a shift toward tighter monetary policy late in 2021.
As we entered 2022, inflation had already surpassed 7.0%. The Russian invasion of Ukraine in February caused food and energy prices to spike, adding additional fuel to the inflationary fire. As a result, the anticipated pace and degree of monetary policy tightening increased substantially. The benchmark federal funds rate began 2022 in a range between 0-0.25% and will end the year between 4.25-4.50%. This equates to the most aggressive rate increase during a 12-month period going back to 1981.
Inflation appears to have peaked on a year-over-year basis in June at 9.0% and has since declined to 7.1%. Despite trending in the right direction, the Fed anticipates more hikes will be necessary to get inflation back to its 2.0% target. Based on their most recent projections published in December, the Fed is projecting rates will peak in 2023 at 5.00-5.25%. The market is currently pricing in a slightly lower peak level, which is referred to as the ‘terminal rate.’
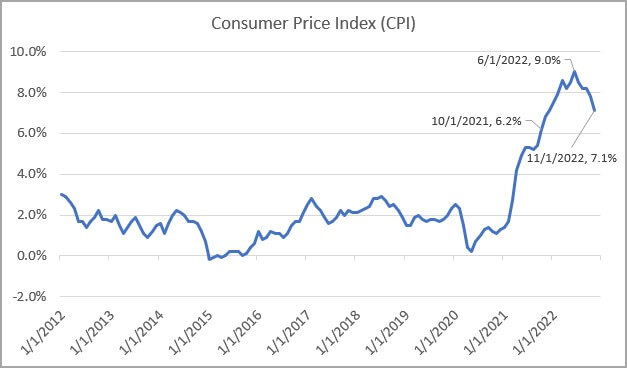
Source: Bureau of Labor Statistics
The rapid rise in interest rates has had a profound effect on asset prices in 2022. Entering the final week of the year, the S&P 500 is down about 18%. International stocks faired slightly better, down about 16%, while U.S. bonds declined more than 12%.
This has been the first negative year for the S&P 500 since 2018, and it marks the worst performance since 2008, when stocks fell 37% due to the Financial Crisis. Typically, when stocks struggle as much as they have this year, bonds tend to do relatively well. Unfortunately, since the volatility is largely the result of the Fed’s rate hikes, bonds have also taken a beating. 2022 marks the worst year on record for the bond market.
The chart below provides a sense of how rare it is for both stocks and bonds to struggle at the same time. As you can see, there have only been three occasions during the past ninety-six years where both the stock and bond markets were negative in the same year.
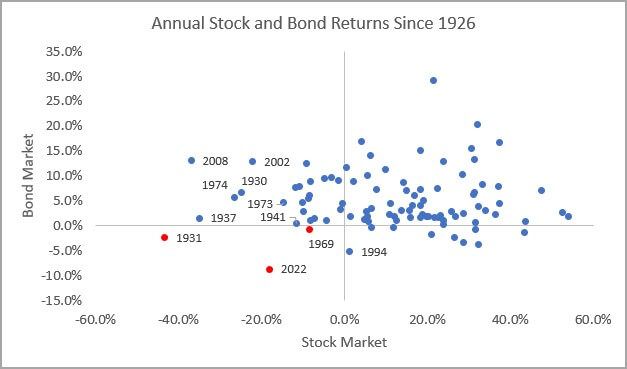 Source: Morningstar Direct. Data from Jan 1927 through 12/23/22. All returns are annual, except 2022, which is year-to-date. The stock market is based on the IA SBBI Large Cap Stock TR Index. The bond market is based on the IA SBBI Intermediate-Term Government Bond Index.
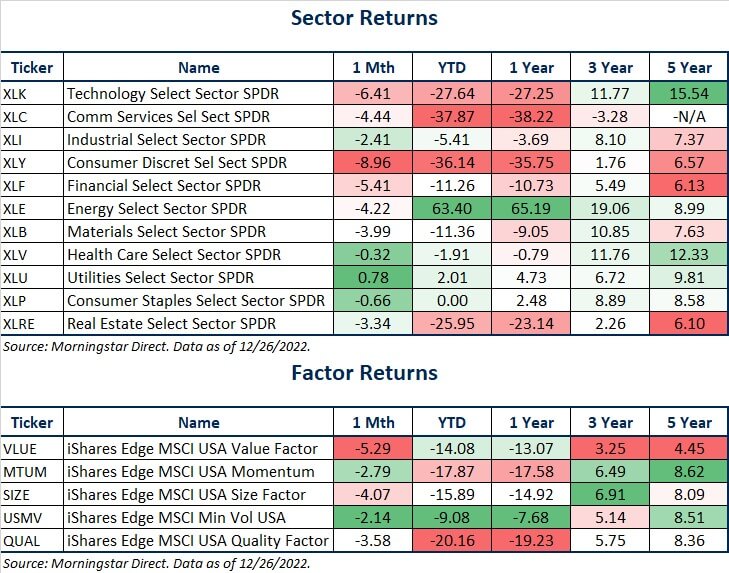
Within the broad asset classes, there were pockets that performed relatively well. In the stock market, smaller value-tilted companies did dramatically better than larger growth-oriented companies. As of 12/23, the S&P 600 Small Value Index was down about 11.3%, while the S&P 500 Large Growth Index was down approximately 29.1%! In the bond market, shorter-term bonds with lower interest rate sensitivity held up substantially better than the broad bond market.
As we turn our attention to 2023, the path of inflation and the Fed’s efforts to curtail it will likely continue to drive the headlines. The Fed’s objective is to return inflation to its 2.0% target without tipping the economy into a recession, an outcome that is referred to as a ‘soft landing’ in the financial media.
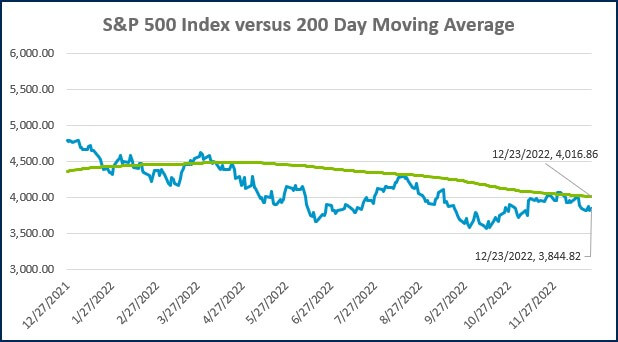
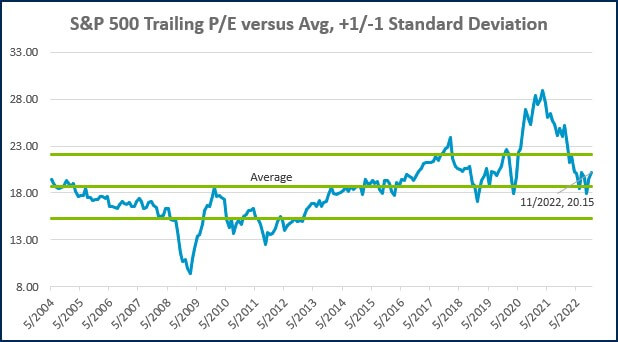
On the bright side, the market’s decline in 2022 provides for higher expected returns moving forward. The elevated valuations and speculative mood of 2021 have largely been washed away. The stock market went from being expensive to fairly priced, with certain segments like small and value looking relatively attractive.
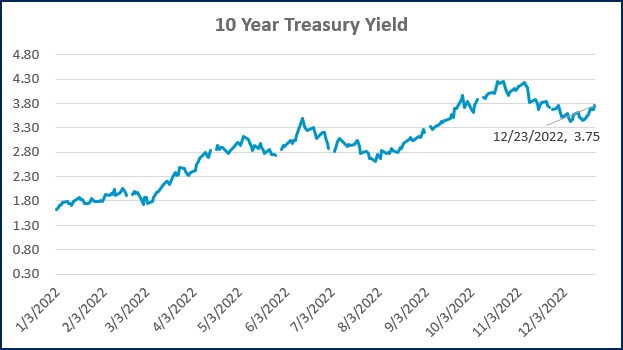
Part of the reason bond returns have been so poor is there was little to no interest income to offset the price decline caused by rising rates. With yields substantially higher going into 2023, bonds are now generating some income that could offset some degree of continued rate increases. If properly managed, even cash can now generate a meaningful yield, which has rarely been the case since the Financial Crisis.
Ultimately, the consensus on Wall Street is expecting a mild recession next year, with the stock market struggling during the first half of the year and recovering in the second half. While this forecast seems plausible, the painful reality is nobody knows what the future has in store for us. As always, we believe the best path forward for investors is to be diversified and stick with your plan.
1. International stocks represented by the MSCI ACWI Ex USA Index, bonds represented by the Bloomberg Aggregate bond Index. All three returns reflect Year-to-date performance through 12/23/2022.
WEEK IN REVIEW
- The S&P Case-Shiller U.S. Home Price Index showed that October marked the fourth consecutive monthly decline in home prices (The data is published with a 2-month lag and reflects a 3-month rolling average). On a YoY basis, home prices are still up 9.2%.
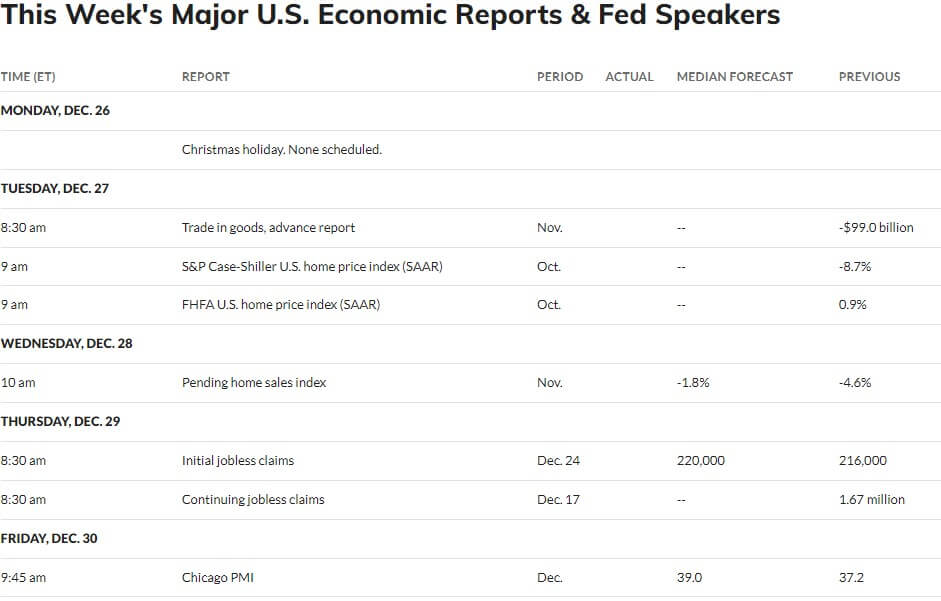
- The economic calendar is relatively light in this holiday-shortened week. Aside from the housing data published on Tuesday, there will be an update to pending home sales on Wednesday and jobless claims on Thursday.
- One of the next big tests for the stock market will be earnings season, which will hit full swing by the second week of January. According to FactSet, earnings estimates for the current quarter have been revised lower to -2.8%. If these forecasts prove accurate, it will be the first YoY decline in stock market earnings since Q3 of 2020.
ECONOMIC CALENDAR
Source: MarketWatch
HOT READS
Markets
- Wall Street and Fed Flopped in Trying to Predict 2022 (WSJ)
- Home Prices Fell in October for Fourth Straight Month (WSJ)
- SPAC Boom Ends in Frenzy of Liquidation (WSJ)
Investing
- 9 Things That Surprised Me in 2022 (Ben Carlson)
- It Could Be Worse (Humble Dollar)
- What Investors Can Learn From a Terrible Year (MorningStar)
Other
- U.S. Online Sports Betting Breaks Record in 2022 (Variety)
- Picture Limitless Creativity at Your Fingertips (Wired)
- 2023 Corvette Z06 vs. 2022 Ford GT (YouTube)
MARKETS AT A GLANCE
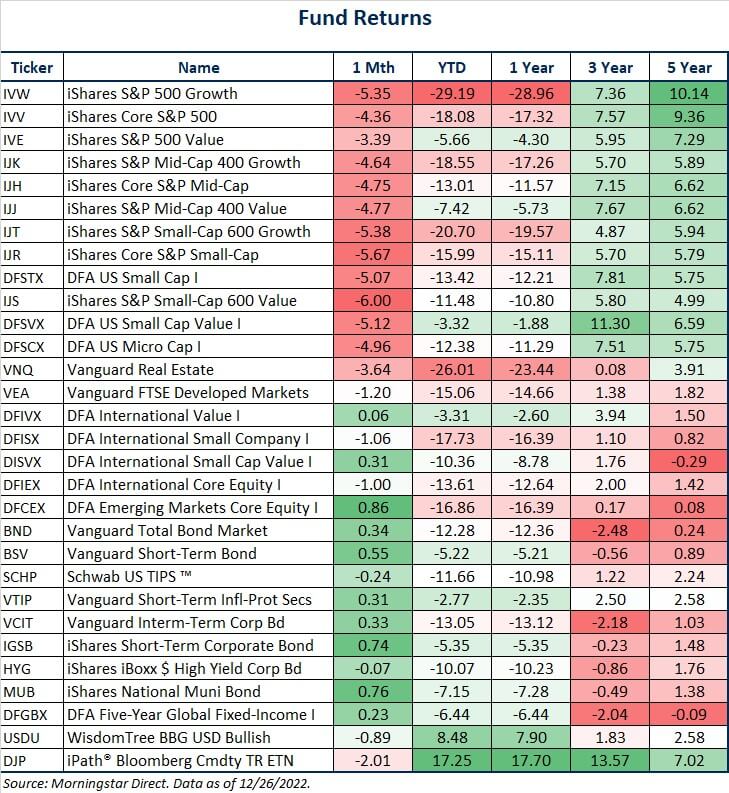
Source: Morningstar Direct.
Source: Morningstar Direct.
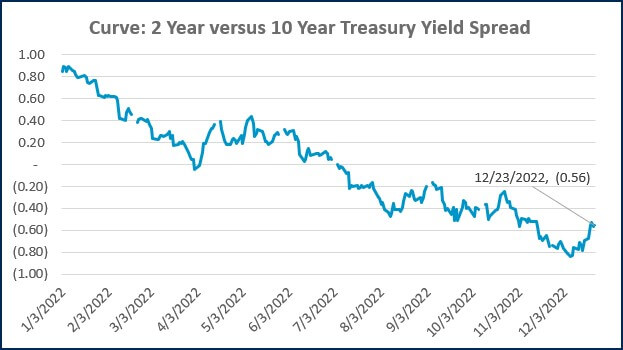
Source: Treasury.gov
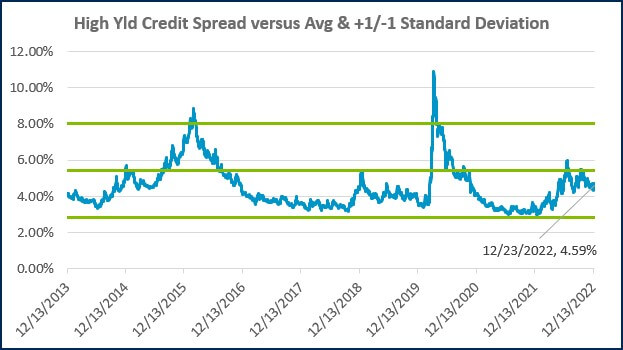
Source: Treasury.gov
Source: FRED Database & ICE Benchmark Administration Limited (IBA)
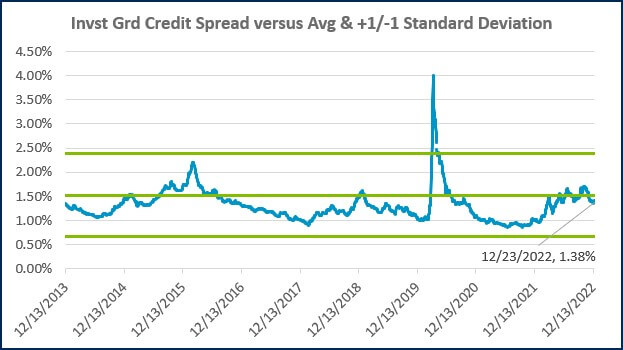
Source: FRED Database & ICE Benchmark Administration Limited (IBA)

- Competition, Achiever, Relator, Analytical, Ideation
Josh Jenkins, CFA
Josh Jenkins, Chief Investment Officer, began his career in 2010. With a background in investment analysis and portfolio management from his previous roles, he quickly advanced to his current leadership position. As a member of the Lutz Financial Board and Chair of the Investment Committee, he guides Lutz Financial’s investment strategy and helps to manage day-to-day operations.
Leading the investment team, Josh directs research initiatives, while overseeing asset allocation, fund selection, portfolio management, and trading. He authors the weekly Financial Market Update, providing clients with timely insights on market conditions and economic trends. Josh values the analytical nature of his work and the opportunity to collaborate with talented colleagues while continuously expanding his knowledge of the financial markets.
At Lutz, Josh exemplifies the firm’s commitment to maintaining discipline and helping clients navigate market uncertainties with confidence. While staying true to the systematic investment process, he works to keep clients' long-term financial goals at the center of his decision-making.
Josh lives in Omaha, NE. Outside the office, he likes to stay active, travel, and play golf.
Recent News & Insights
Lutz Ranked #11 in 2025 Remarkabrand Index for Top Accounting Firm Brands
A Decade of Volatility + 6.25.25
The Lutz Ledger 2025
Lutz Financial Named an Accounting Today 2025 Wealth Magnet


.jpg?width=300&height=175&name=Mega%20Menu%20Image%20(1).jpg)
%20(1).jpg?width=300&height=175&name=Mega%20Menu%20Image%20(2)%20(1).jpg)
%20(1)-Mar-08-2024-09-27-14-7268-PM.jpg?width=300&height=175&name=Untitled%20design%20(6)%20(1)-Mar-08-2024-09-27-14-7268-PM.jpg)

%20(1)-Mar-08-2024-09-11-30-0067-PM.jpg?width=300&height=175&name=Untitled%20design%20(3)%20(1)-Mar-08-2024-09-11-30-0067-PM.jpg)
%20(1).jpg?width=300&height=175&name=Mega%20Menu%20Image%20(3)%20(1).jpg)
%20(1).jpg?width=300&height=175&name=Mega%20Menu%20Image%20(4)%20(1).jpg)
%20(1).jpg?width=300&height=175&name=Mega%20Menu%20Image%20(5)%20(1).jpg)
-Mar-08-2024-08-50-35-9527-PM.png?width=300&height=175&name=Untitled%20design%20(1)-Mar-08-2024-08-50-35-9527-PM.png)


.jpg)

